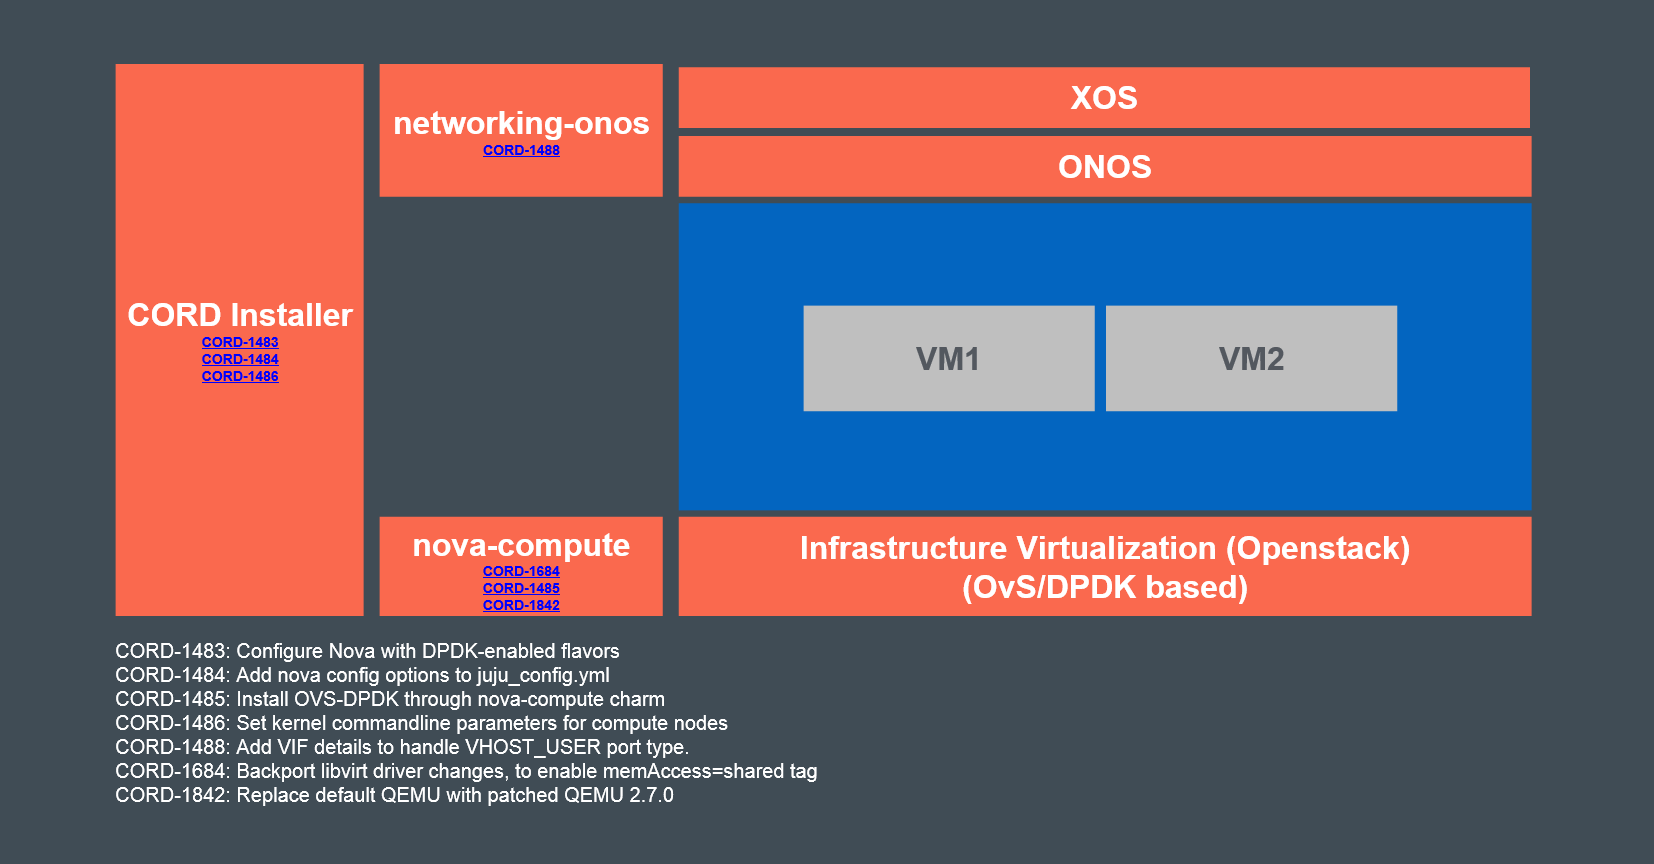
OVS-DPDK was integrated into CORD. Working group document for the same is available here and the top level JIRA ticket here.
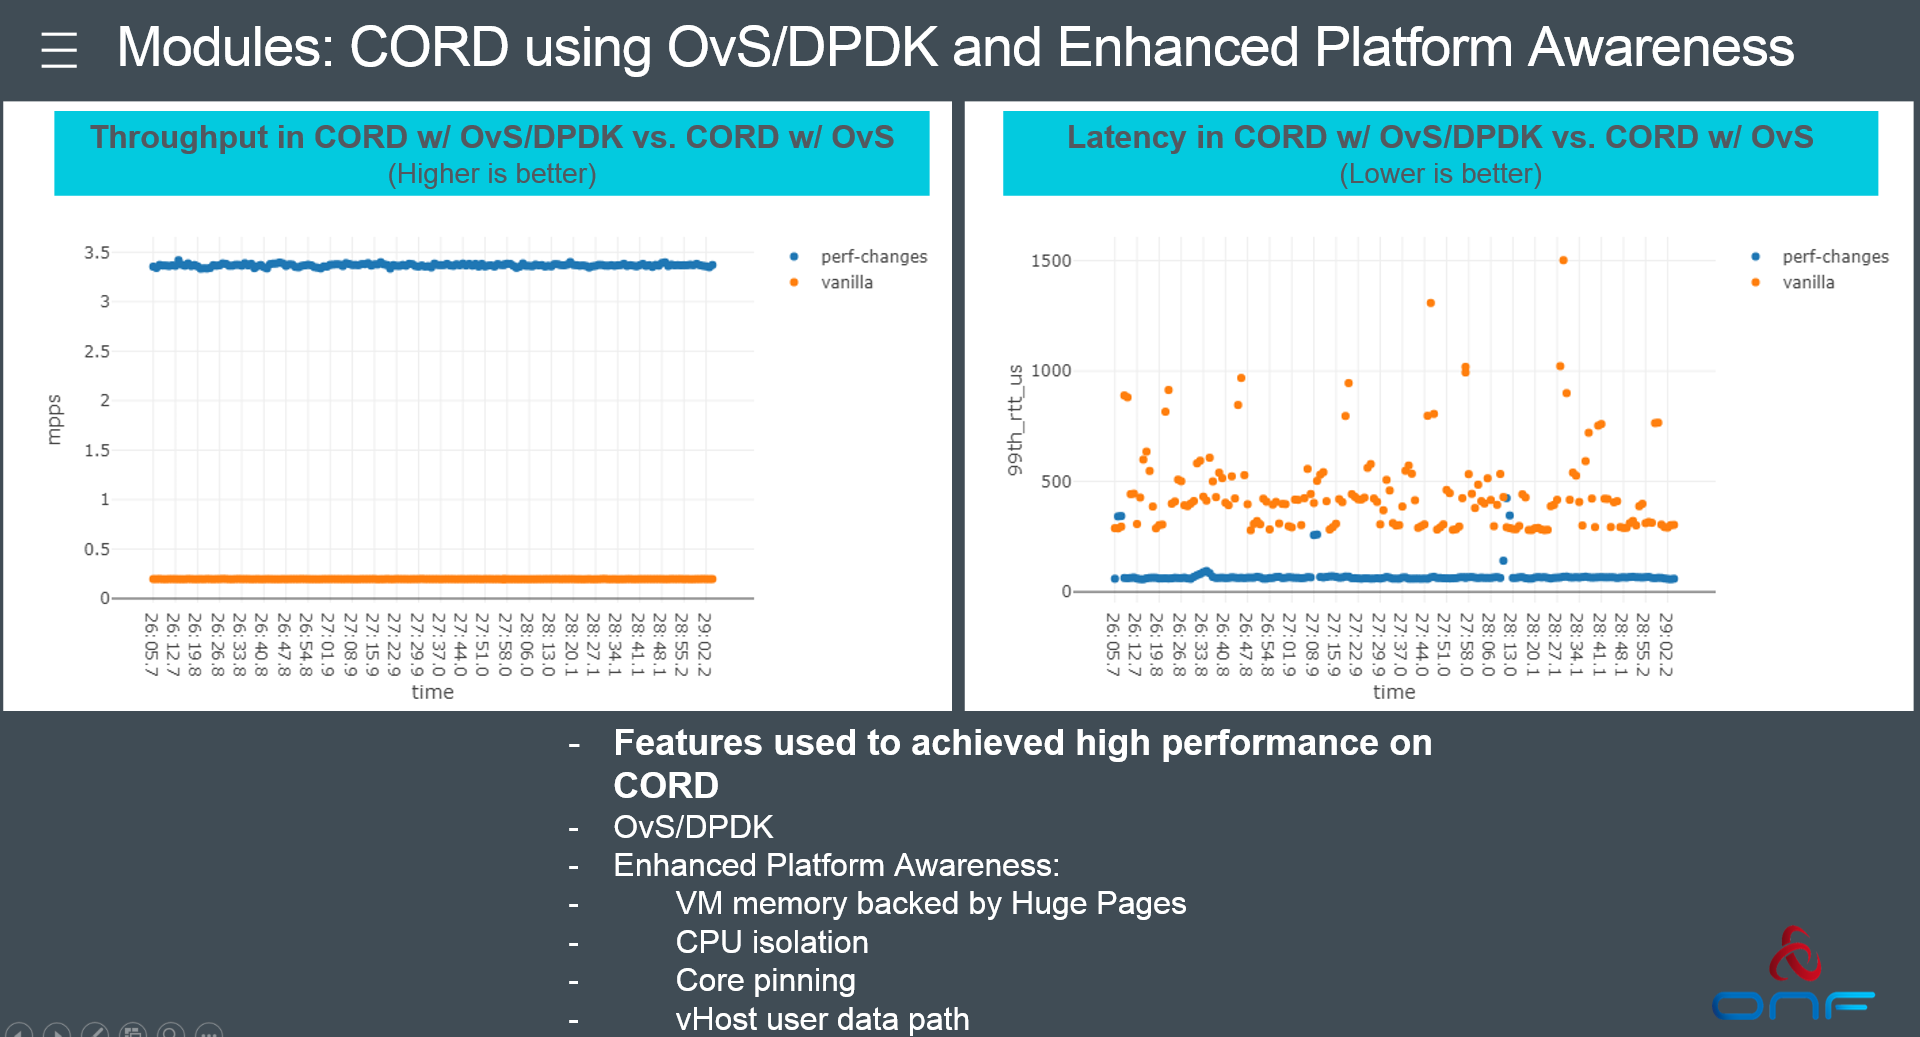
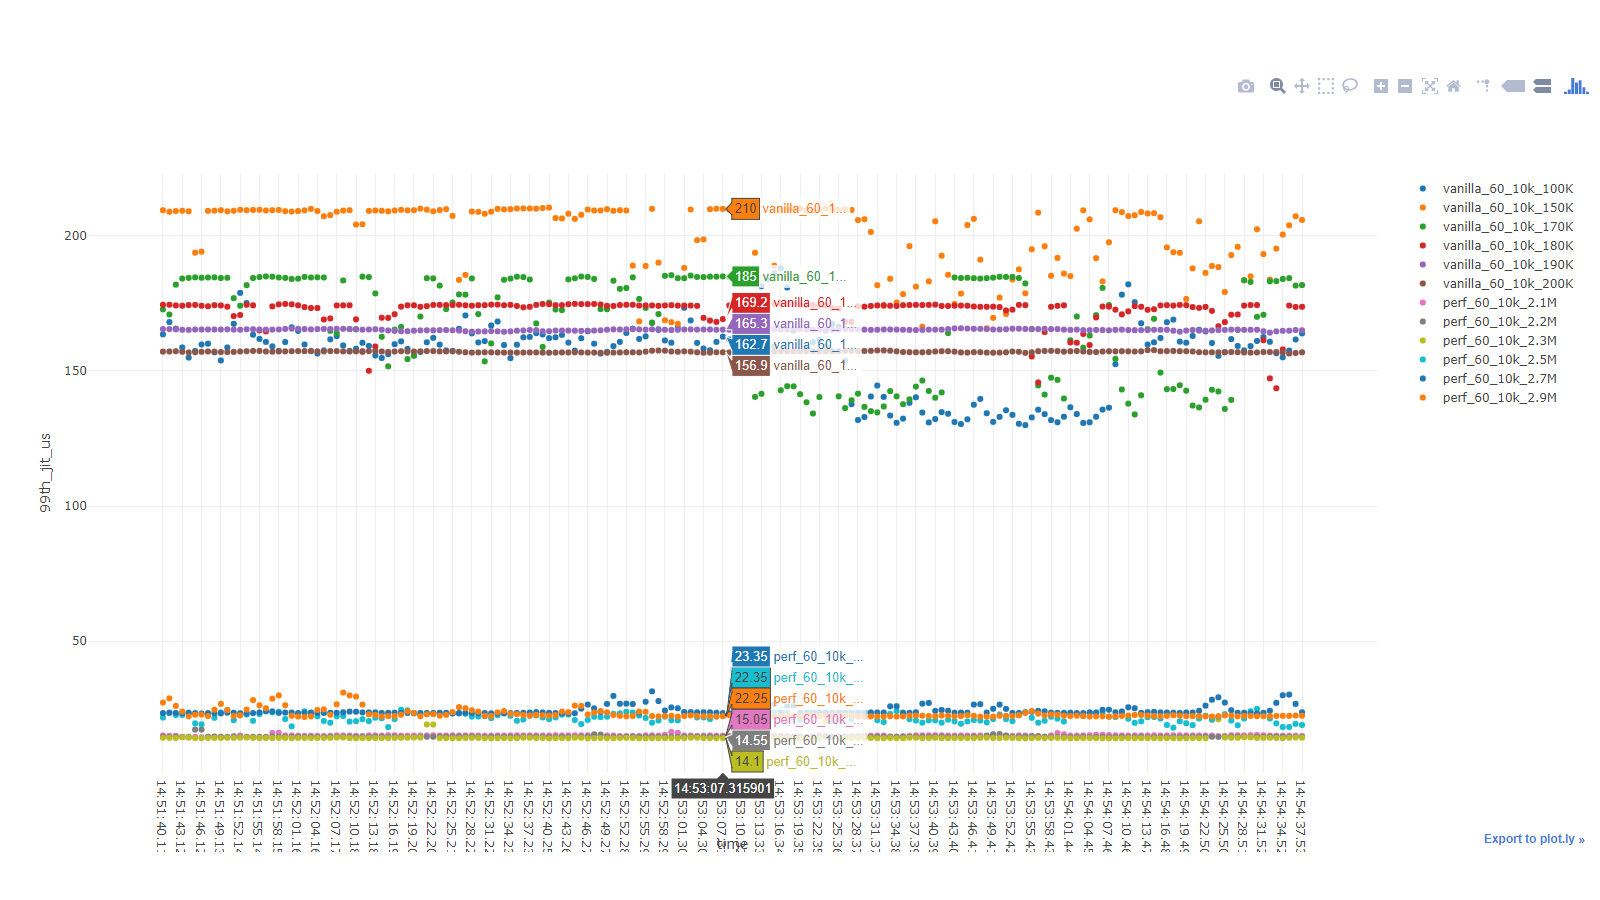
The below article captures the performance measurement methodology to compare OVS (vanilla) and OVS-DPDK (perf) setups.
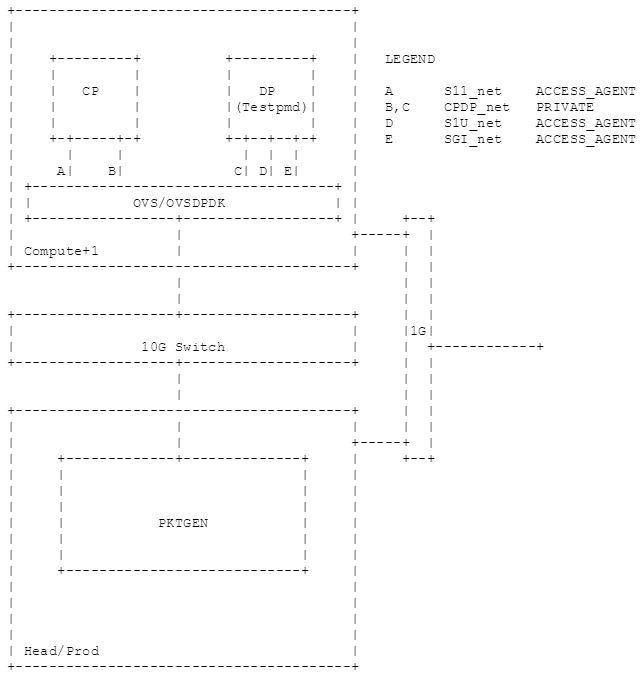
This yaml file was used to bring up CORD to test vanilla setup (OVS-kernel). The same file has DPDK related configs commented out. This yaml file was used to spin up the flavors and networking. A simpler setup could be used for testing performance.
testpmd.qcow2 image with DPDK installed, hugepages enabled, UIO drivers loaded, was used for the VM. Refer this link to add the image to CORD. Spin up a DP VM from the GUI or using REST API of XOS.
In the VM run testpmd with port D (or E) which is of network type ACCESS_AGENT.
sudo su

# Use utility script to list all networking interfaces
dpdk/usertools/dpdk-devbind.py -s

# Remove test interface from routing table
ip addr flush ens3

# Unbind the test interface from Linux and bind it to igb_uio driver, using PCI BDF
dpdk/usertools/dpdk-devbind.py -b igb_uio 00:03.0

# Run testpmd (args for -l if for a 2 CPU VM)
dpdk/build/app/testpmd -l 0-1 -- --port-topology=chained --disable-hw-vlan --forward-mode=macswap
On the head node or a separate traffic generator node, install BESS and run nefeli/trafficgen as below -
# Memory setup
sudo sysctl vm.nr_hugepages=1024
sudo -E umount /dev/hugepages
sudo -E mkdir -p /dev/hugepages
sudo -E mount -t hugetlbfs -o pagesize=2048k none /dev/hugepages
# Userspace IO driver setup
sudo modprobe uio
sudo modprobe uio_pci_generic

# Install BESS
sudo apt-get install -y python python-pip python-scapy libgraph-easy-perl
pip install --user grpcio
git clone https://github.com/NetSys/bess.git && cd bess
CXX=g++-7 ./container_build.py bess
export BESS_PATH=$(pwd)

# NIC setup
./bin/dpdk-devbind.py -s
# Pick the PCI device to be used for traffic generation
sudo ./bin/dpdk-devbind.py -b uio_pci_generic 05:00.0

# Install trafficgen
cd -
pip install --user git+https://github.com/secdev/scapy
git clone https://github.com/nefeli/trafficgen.git && cd trafficgen

# Run trafficgen
./run.py
set csv <filename>
start 05:00.0 udp pkt_size=60, dst_mac="fa:16:3e:ae:eb:82", src_ip="1.1.1.1", dst_ip="2.2.2.2", num_flows=1000, pps=3000000
monitor port

# start <pci_bus_id> <generator_mode> pkt_size=<size_of_packet_wo_CRC>, dst_mac="<mac addr of port D>", src_ip="<src_addr_in_pkt>", dst_ip="dst_addr_in_pkt", num_flows=<1, 1000, 10000, 1000000, how many unique flows>, pps=<100000, 200000, 300000, 500000, etc., until drops occur>
# monitor command will output results into "filename" until ctrl+c
Commands could be sent together like below. It might be helpful for scripting. (ctrl+c to exit/stop monitoring the port)
./run.py set csv /tmp/test1.log -- start 05:00.0 udp pkt_size=60, dst_mac="fa:16:3e:ae:eb:82", src_ip="1.1.1.1", dst_ip="2.2.2.2", num_flows=1000, pps=3000000 -- monitor port
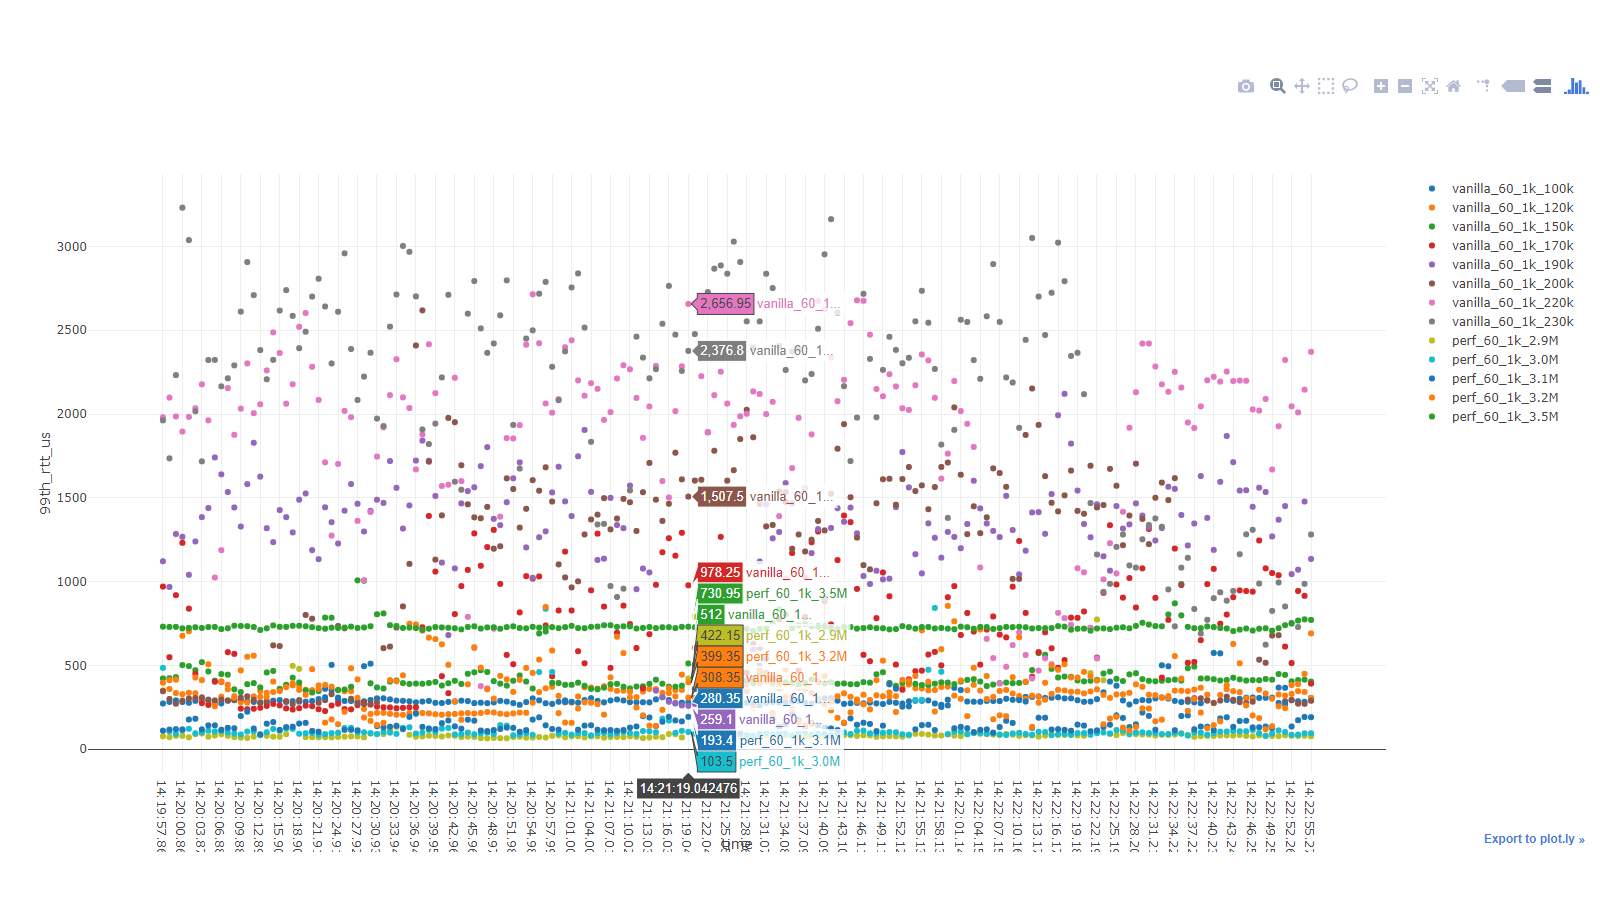
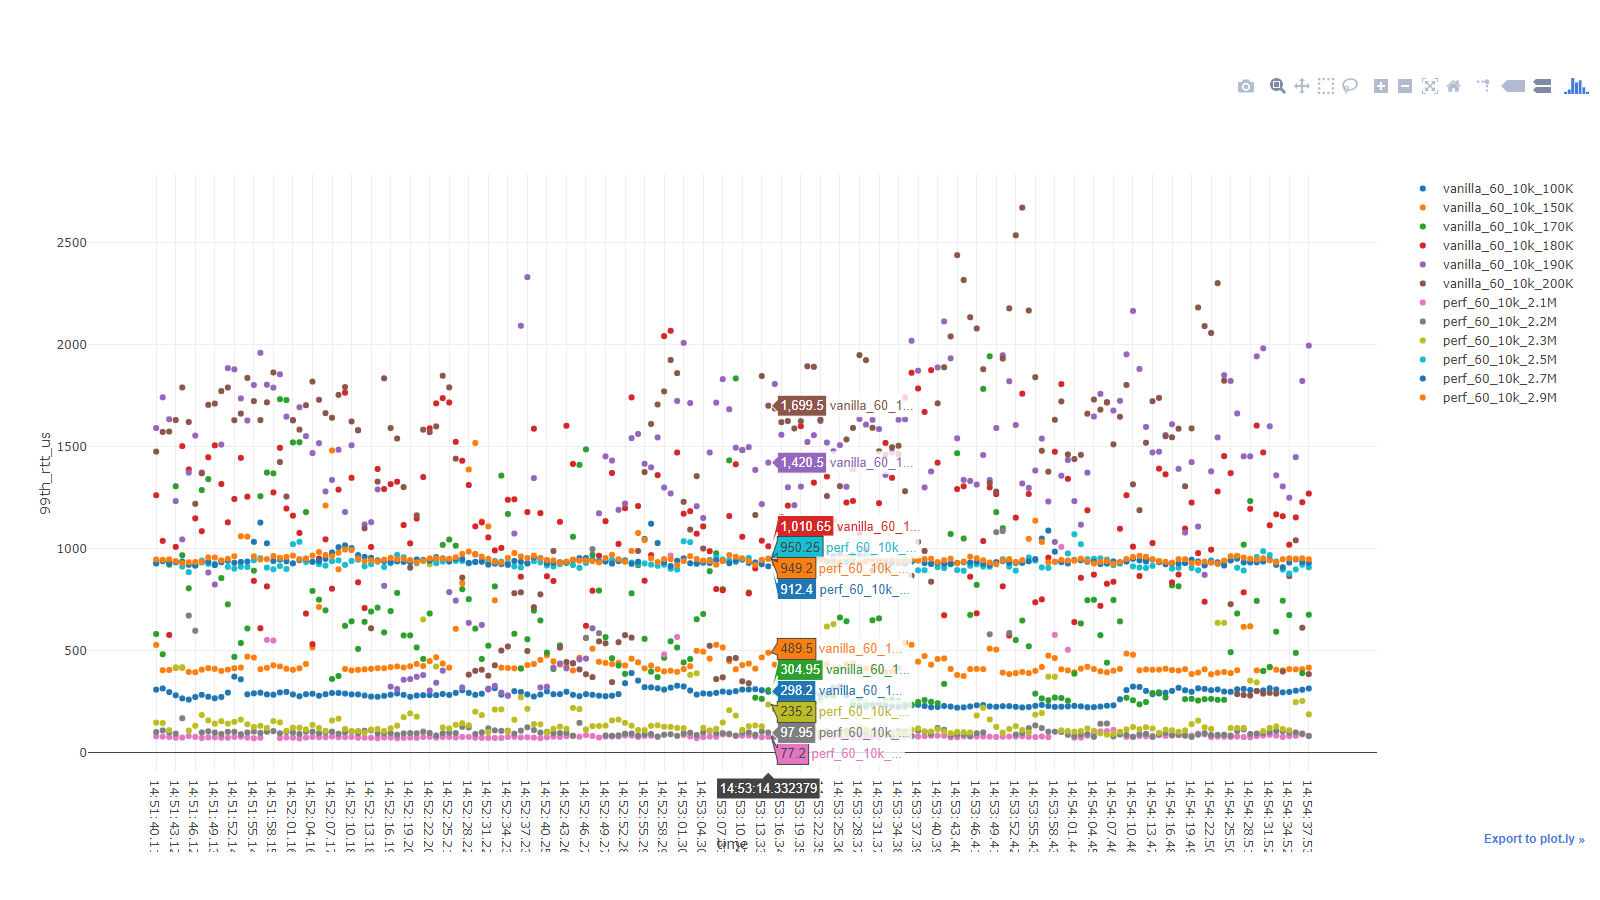
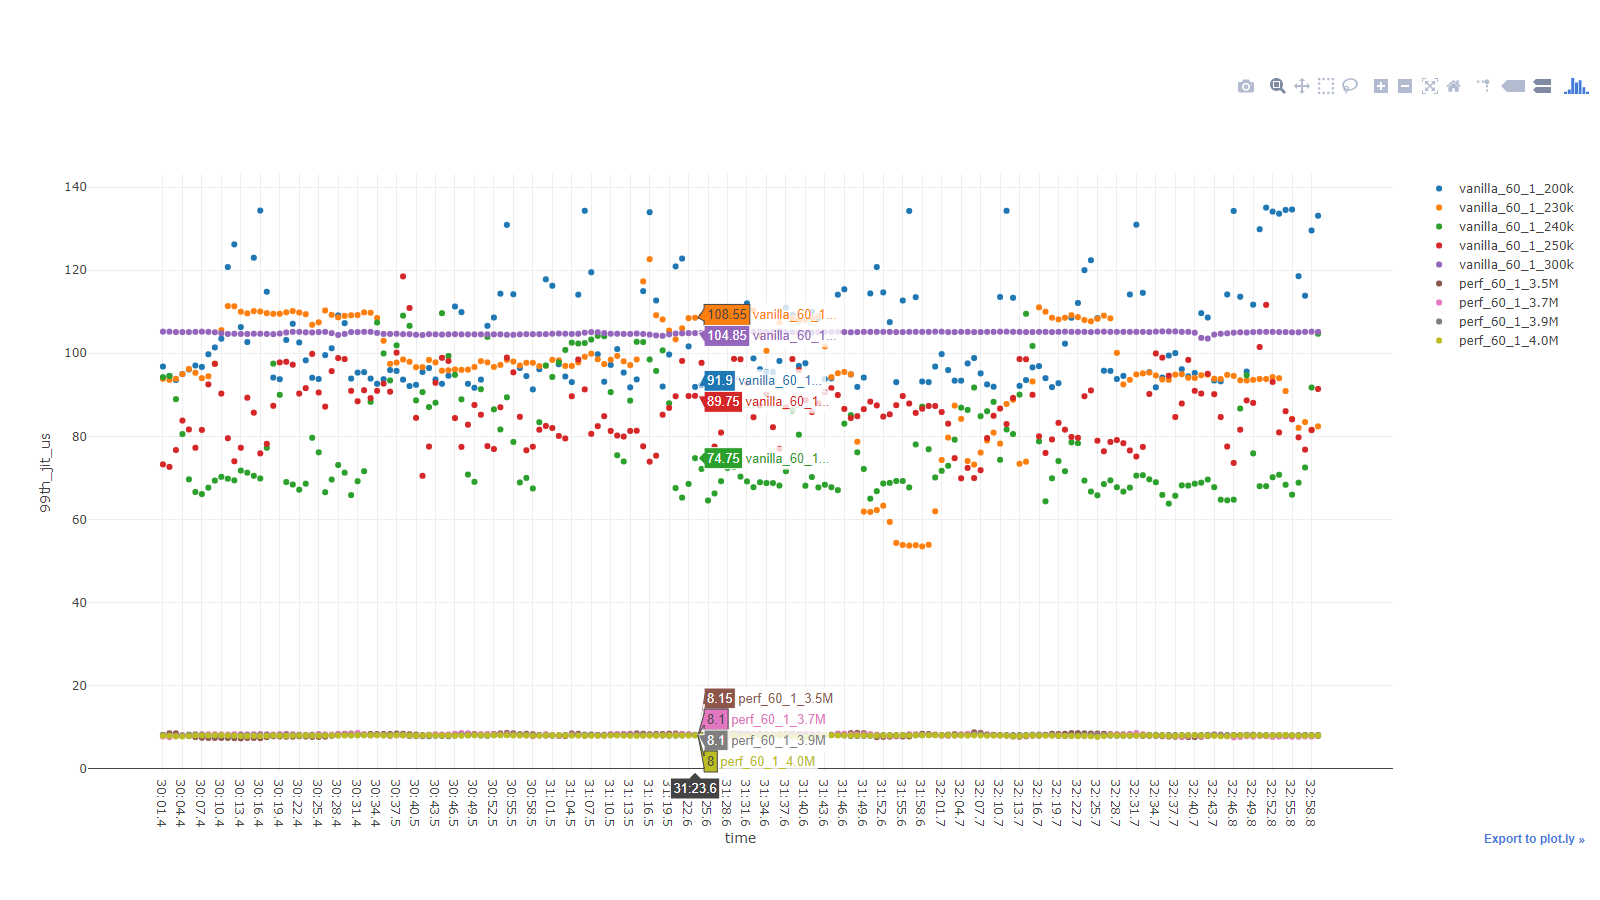
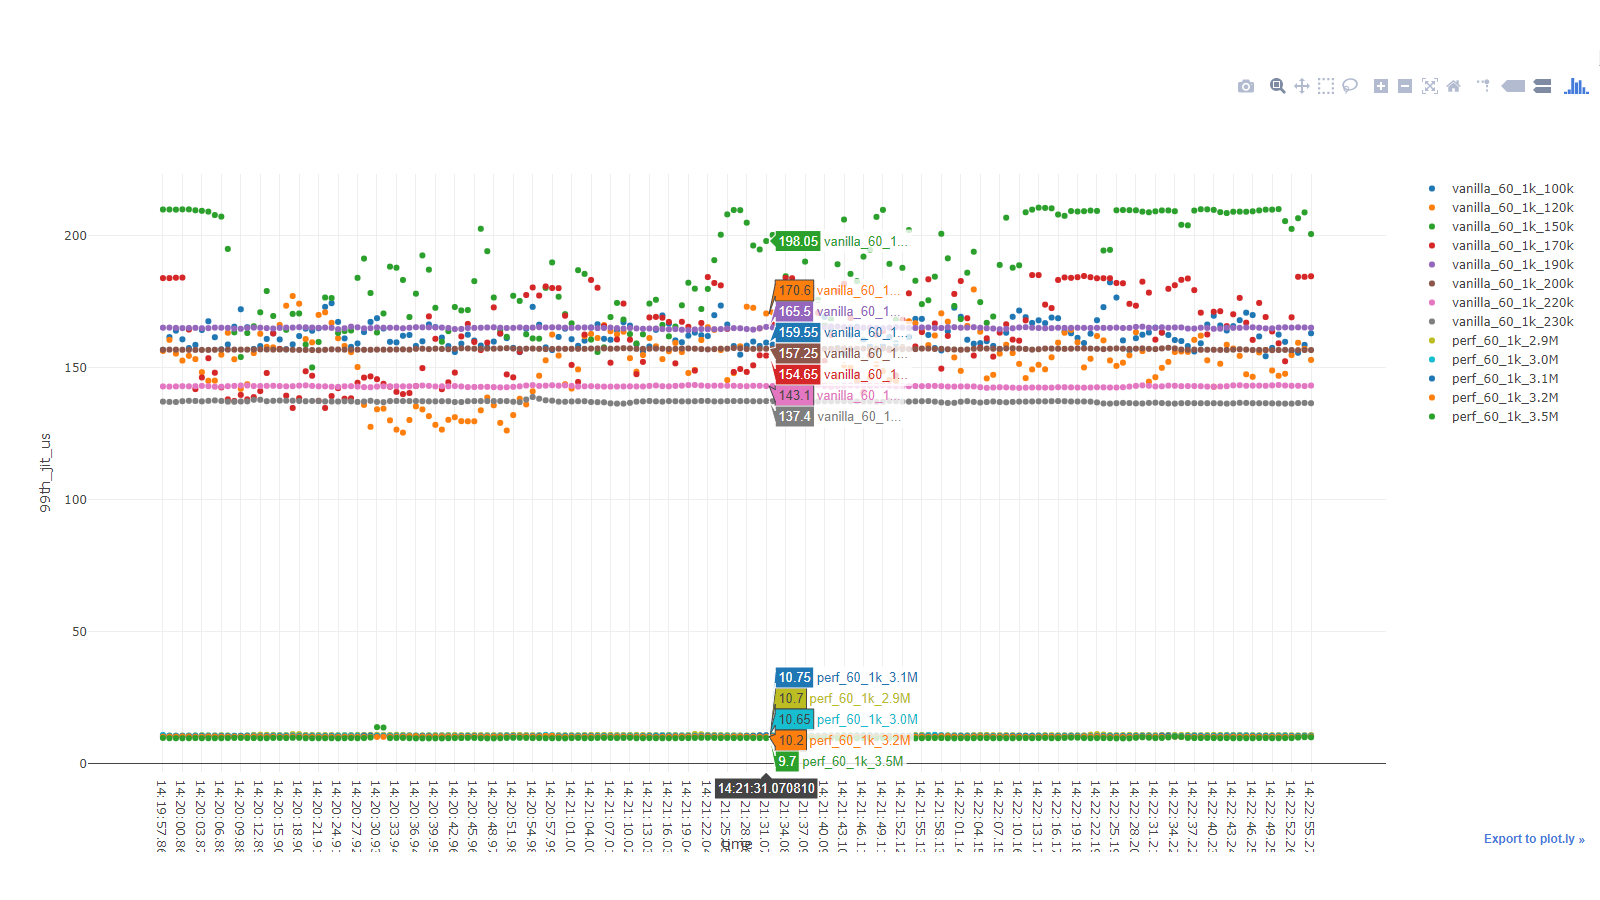
Simplified version of the results presented at MWCA
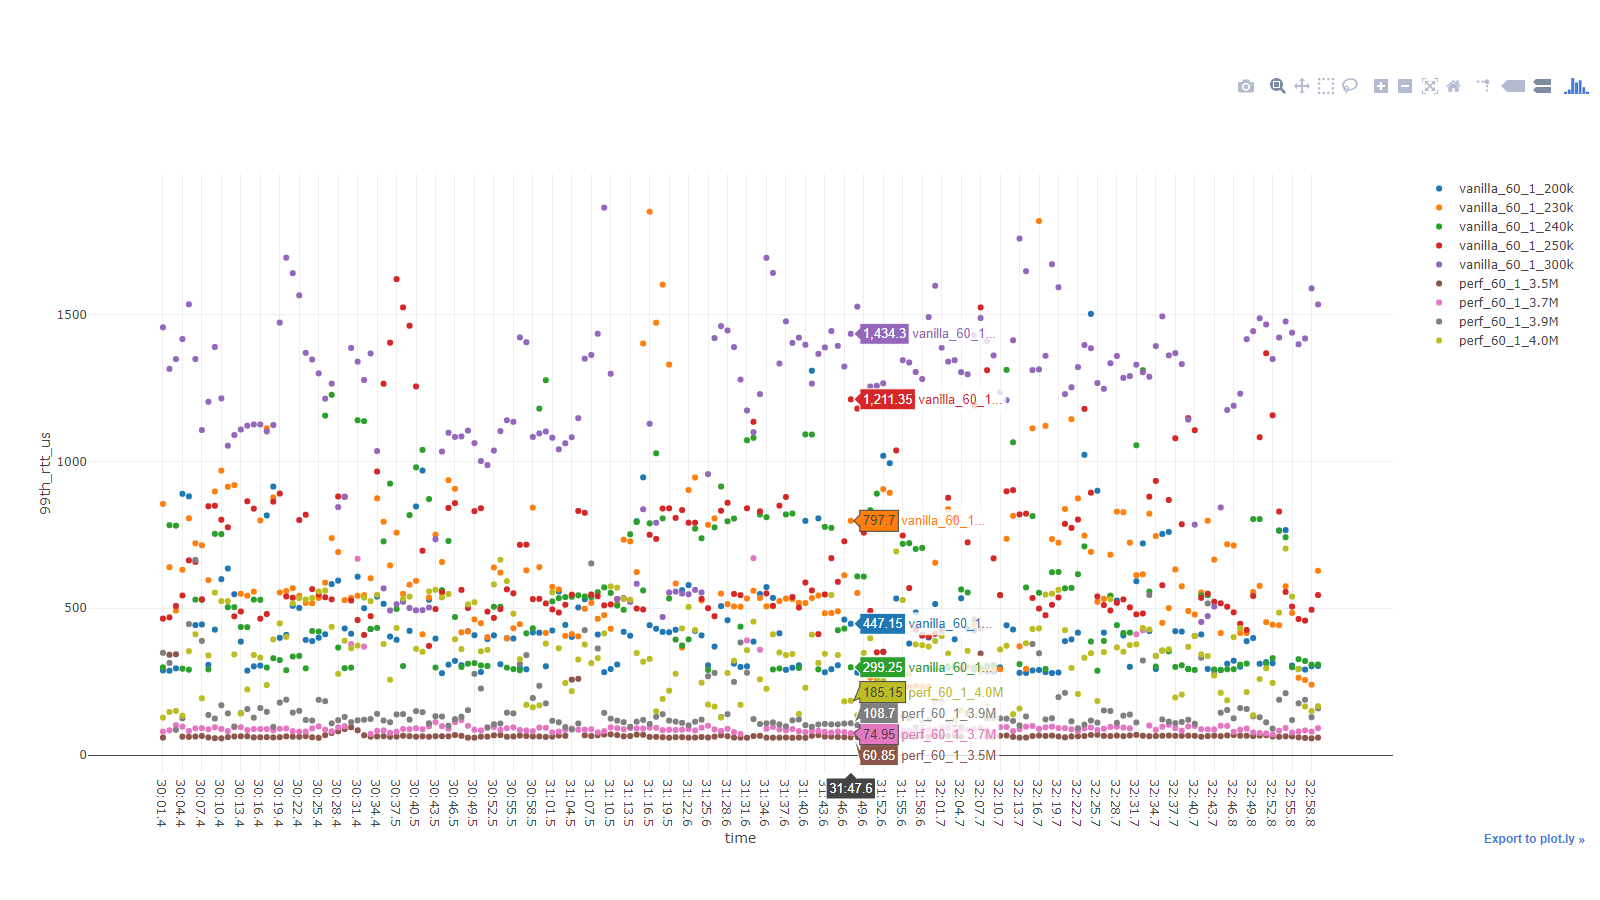
The legend in the below graphs follow this pattern version_pktSize_numFlows_offeredPPS
