The following are the steps to install A-CORD components in CORD POD (CloudLab single-node-pod based installation):
Install CORD POD on a ClouldLab machine
Install CORD POD on a CloudLab machine using the procedures described in Configuring CORD
- Ensure the CORD portal is up and all the mandatory services are up and running
Install Monitoring Service
vagrant@prod:~$ cd service-profile/cord-pod
vagrant@prod:~/service-profile/cord-pod$ make cord-monitoringservice
The 'make cord-monitoringservice' performs the following functionalities:
- On-boarding of Monitoring service components (Django Models, Synchronizer, TOSCA/REST front end interfaces) into XOS
- Instantiation of Monitoring service
- Creation of Monitoring channel (for user padmin@vicci.org) and Loading of Monitoring dashboard that uses Monitoring channel
Create a Monitoring Channel
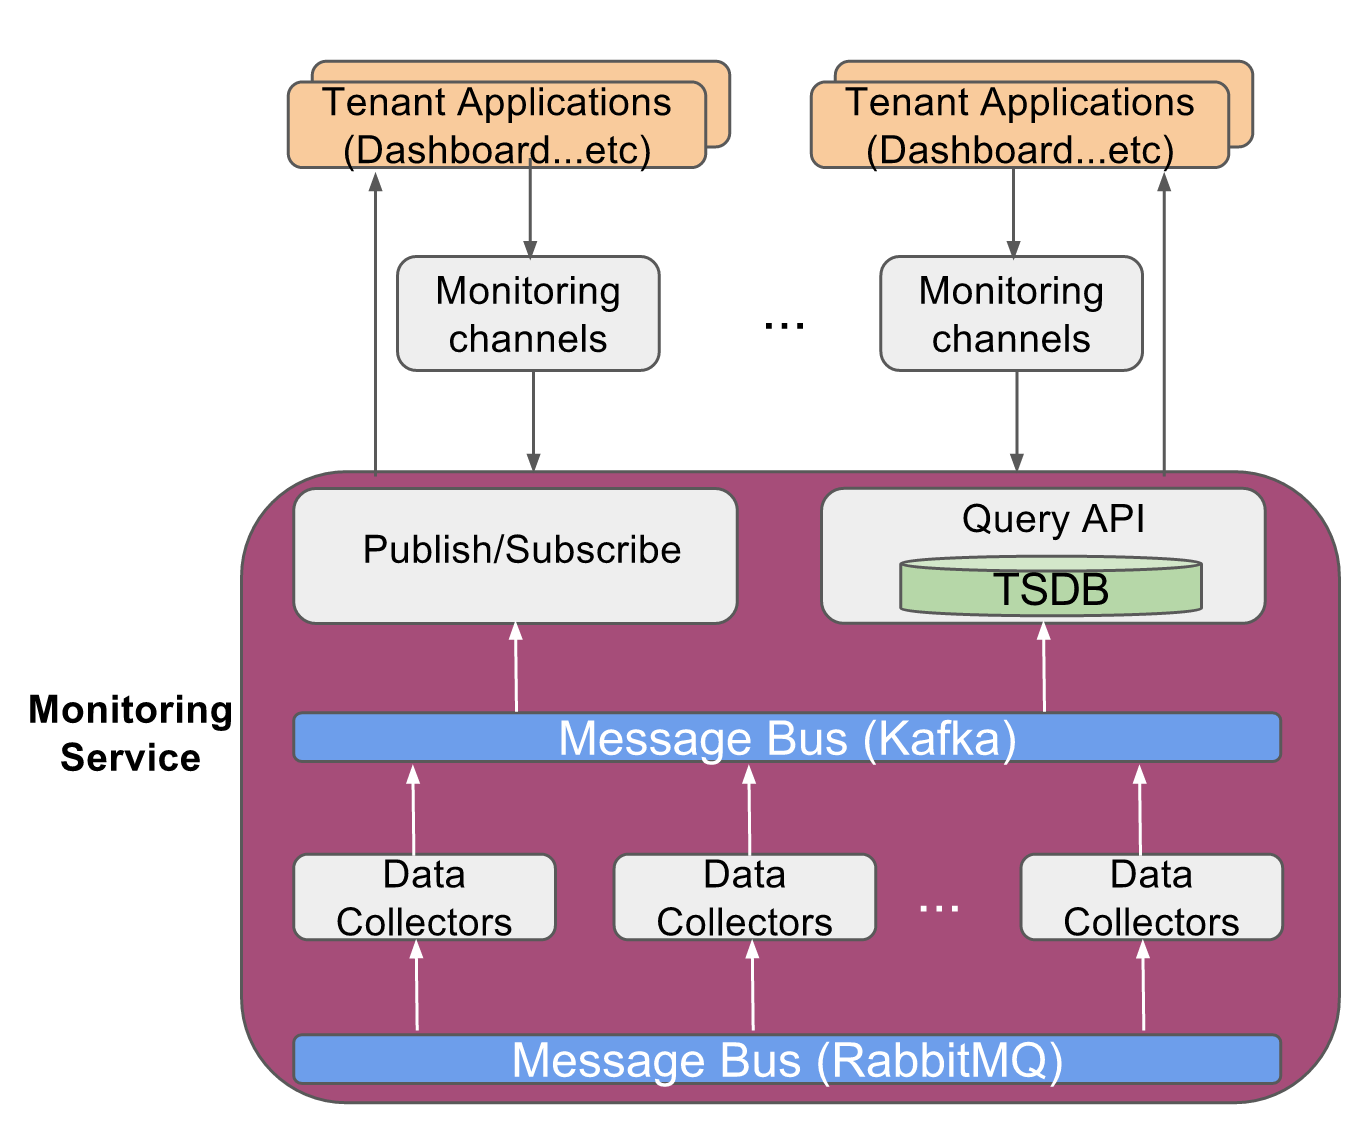
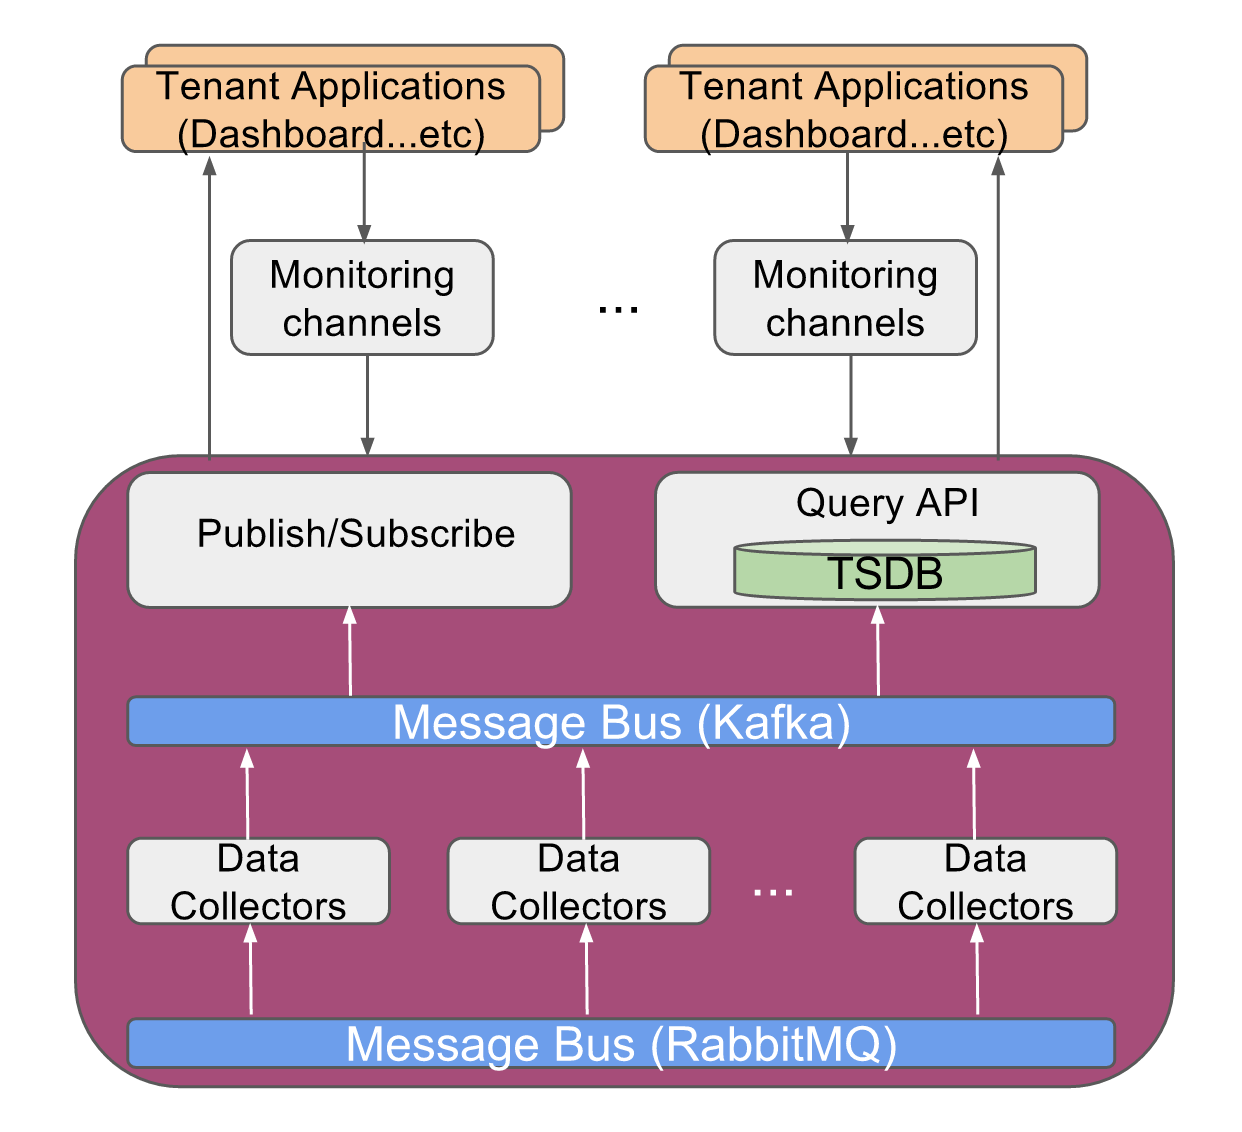
Monitoring Channel is a lightweight proxy docker container for every tenant of the Monitoring service, such that each tenant is able to access only to the instrumentation data of the network resources belonging to that tenant. Typically the tenants would be the analytics applications running on top of this service.
As described in the previous section, the installation process of monitoring service also includes creation of a Monitoring channel for CORD default admin user 'padmin@vicci.org'.
If additional Monitoring Channels are to be created for other user(s), use TOSCA interface or REST APIs as described in Creation of Service Tenants
NOTE: On-boarding of monitoring service and creation of the monitoring channel takes ~5 minutes for them to be completely ready
Deploy Monitoring Publish Agents
Even though monitoring service, channel and dashboard are fully ready, there won't be any telemetry data displayed in the dashboard as there are no components feeding the data in to it.
So the next step in the installation process is deploying the monitoring publish agents that feeds the analytics data into Monitoring service. NOTE: Not all the steps in this process are automated yet, so it requires some manual intervention.
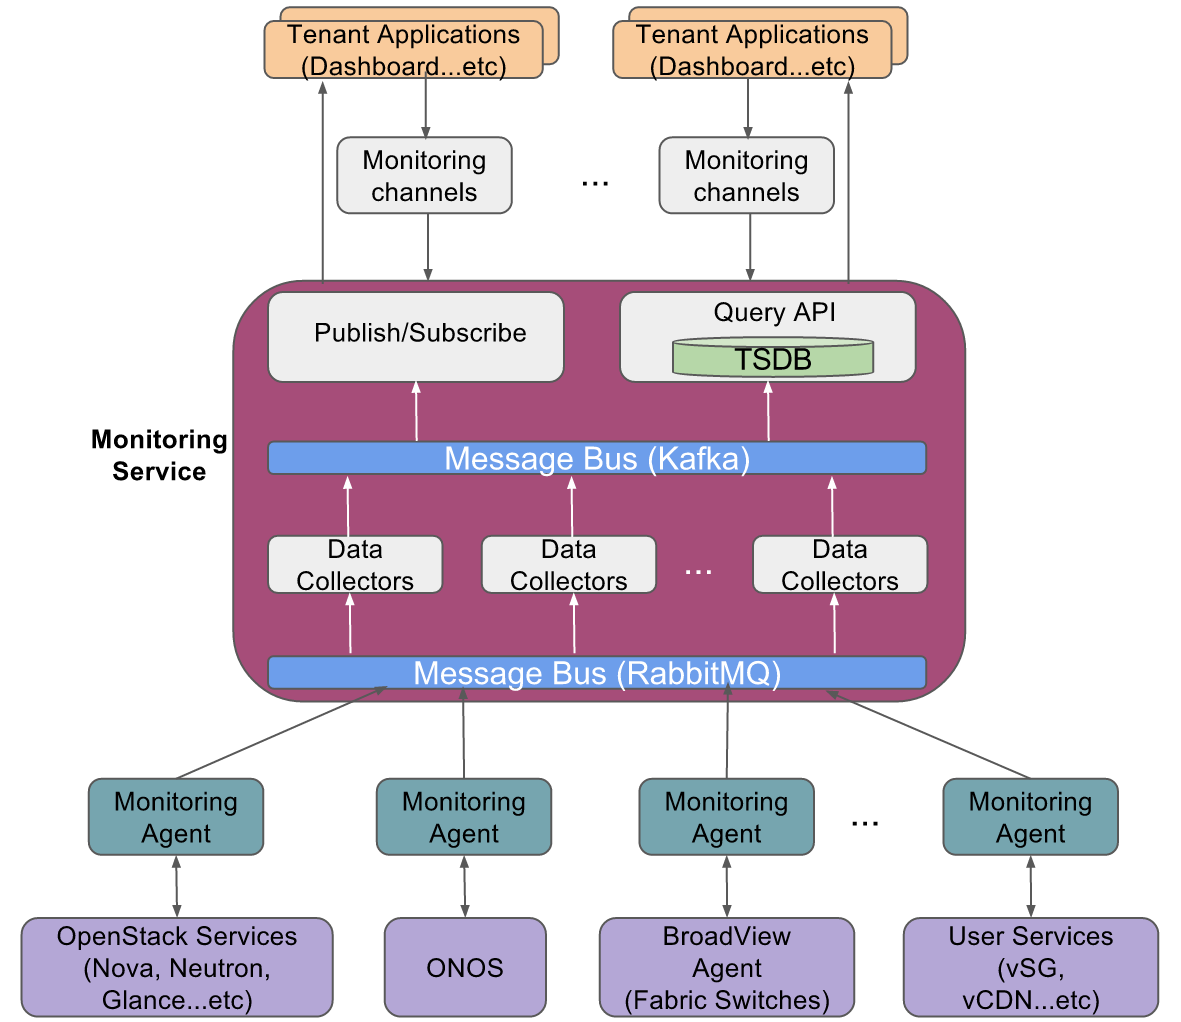
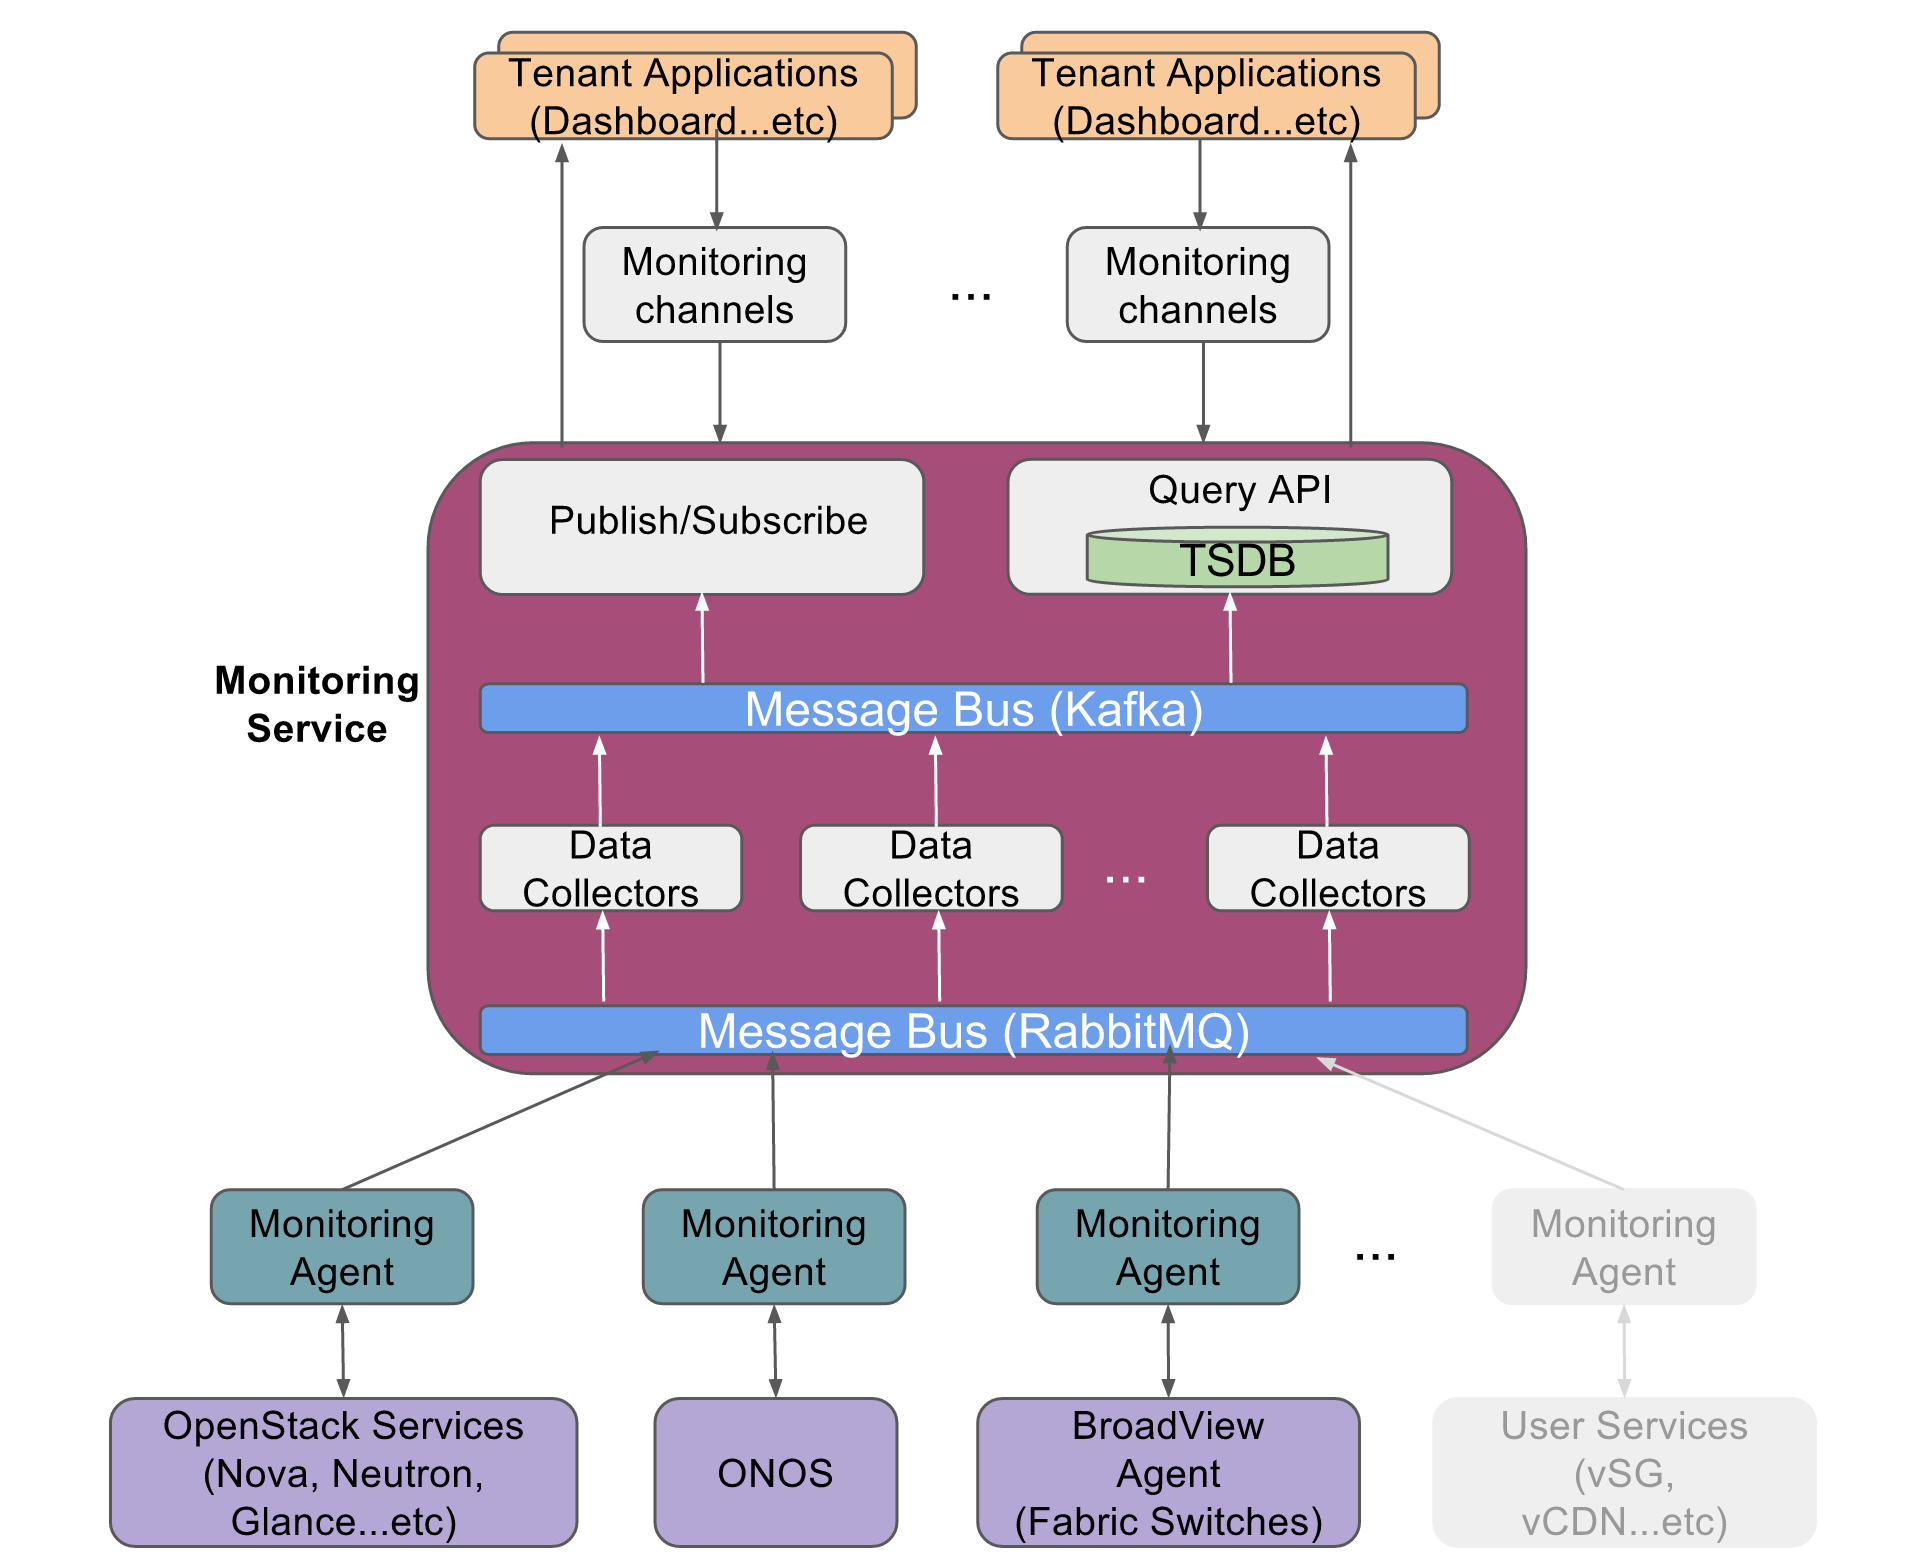
There are multiple sources of probe data integrated into monitoring service in the CORD-POD environment:
- OpenStack services (Nova, Neutron...etc)
- OpenStack services provide compute, memory, disk and network level metrics at instance level
- It uses ceilometer data collection agents (notification and central) to collect the data from different services of OpenStack (Nova, Neutron, Glance...etc)
- The ceilometer agents collects the data from OpenStack services using PULL mechanism and PUSH mechanism and then feed it into monitoring service
- ONOS
- ONOS SDN controller provides the network level analytics data
- The same ceilometer data collection agents (notification and central) will be used to collect the data from the ONOS
- User Defined Services (vSG, vCDN, ...etc)
- These user defined services will have monitoring agents embedded in their VNFs that collects various service specific telemetry data from the VNFs and feed the data into the monitoring service
- BroadView agents on Fabric white box switches (Broadcom merchant silicon based)
- BroadView agents on fabric white boxes provides BST (Buffer Statistics Tracking) and PT (Packet Trace) based congestion analytics data (https://github.com/Broadcom-Switch/BroadView-Instrumentation)
- BroadView collection module (https://github.com/openstack/broadview-collector) collects the analytics data from BroadView agents over JSON RPC and feeds the data into Monitoring service
The current CORD release (Mysterious-Decision) supports following sources of probe data:
Enable Monitoring of Infrastructure Services
vagrant@prod:~/service-profile/cord-pod$ make install-inframonitoring-agents
vagrant@prod:~/service-profile/cord-pod$ make enable-inframonitoring
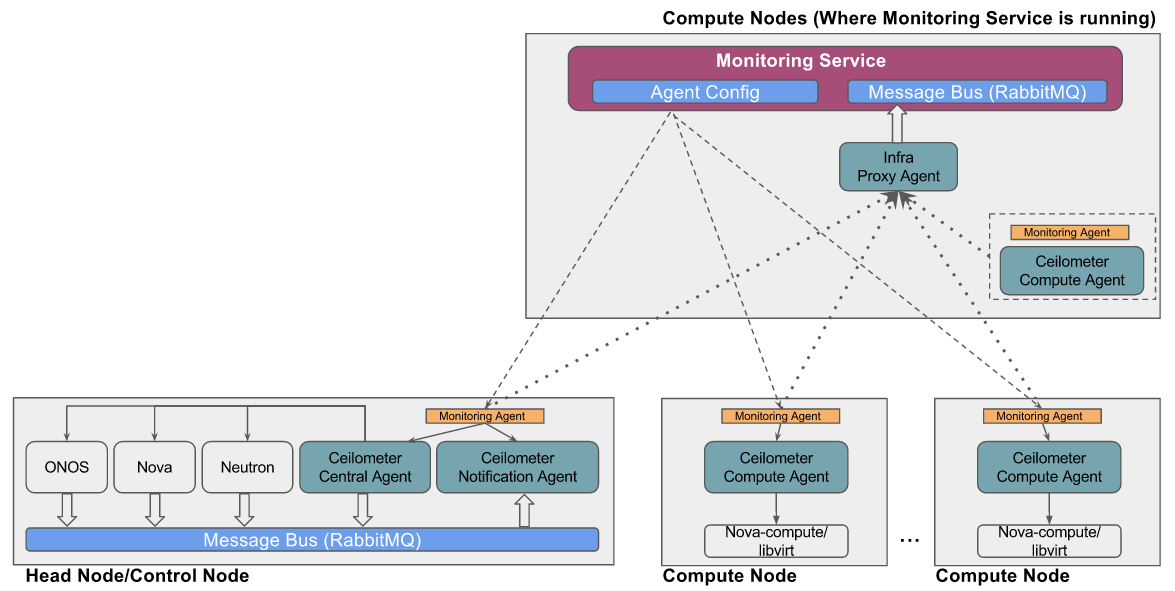
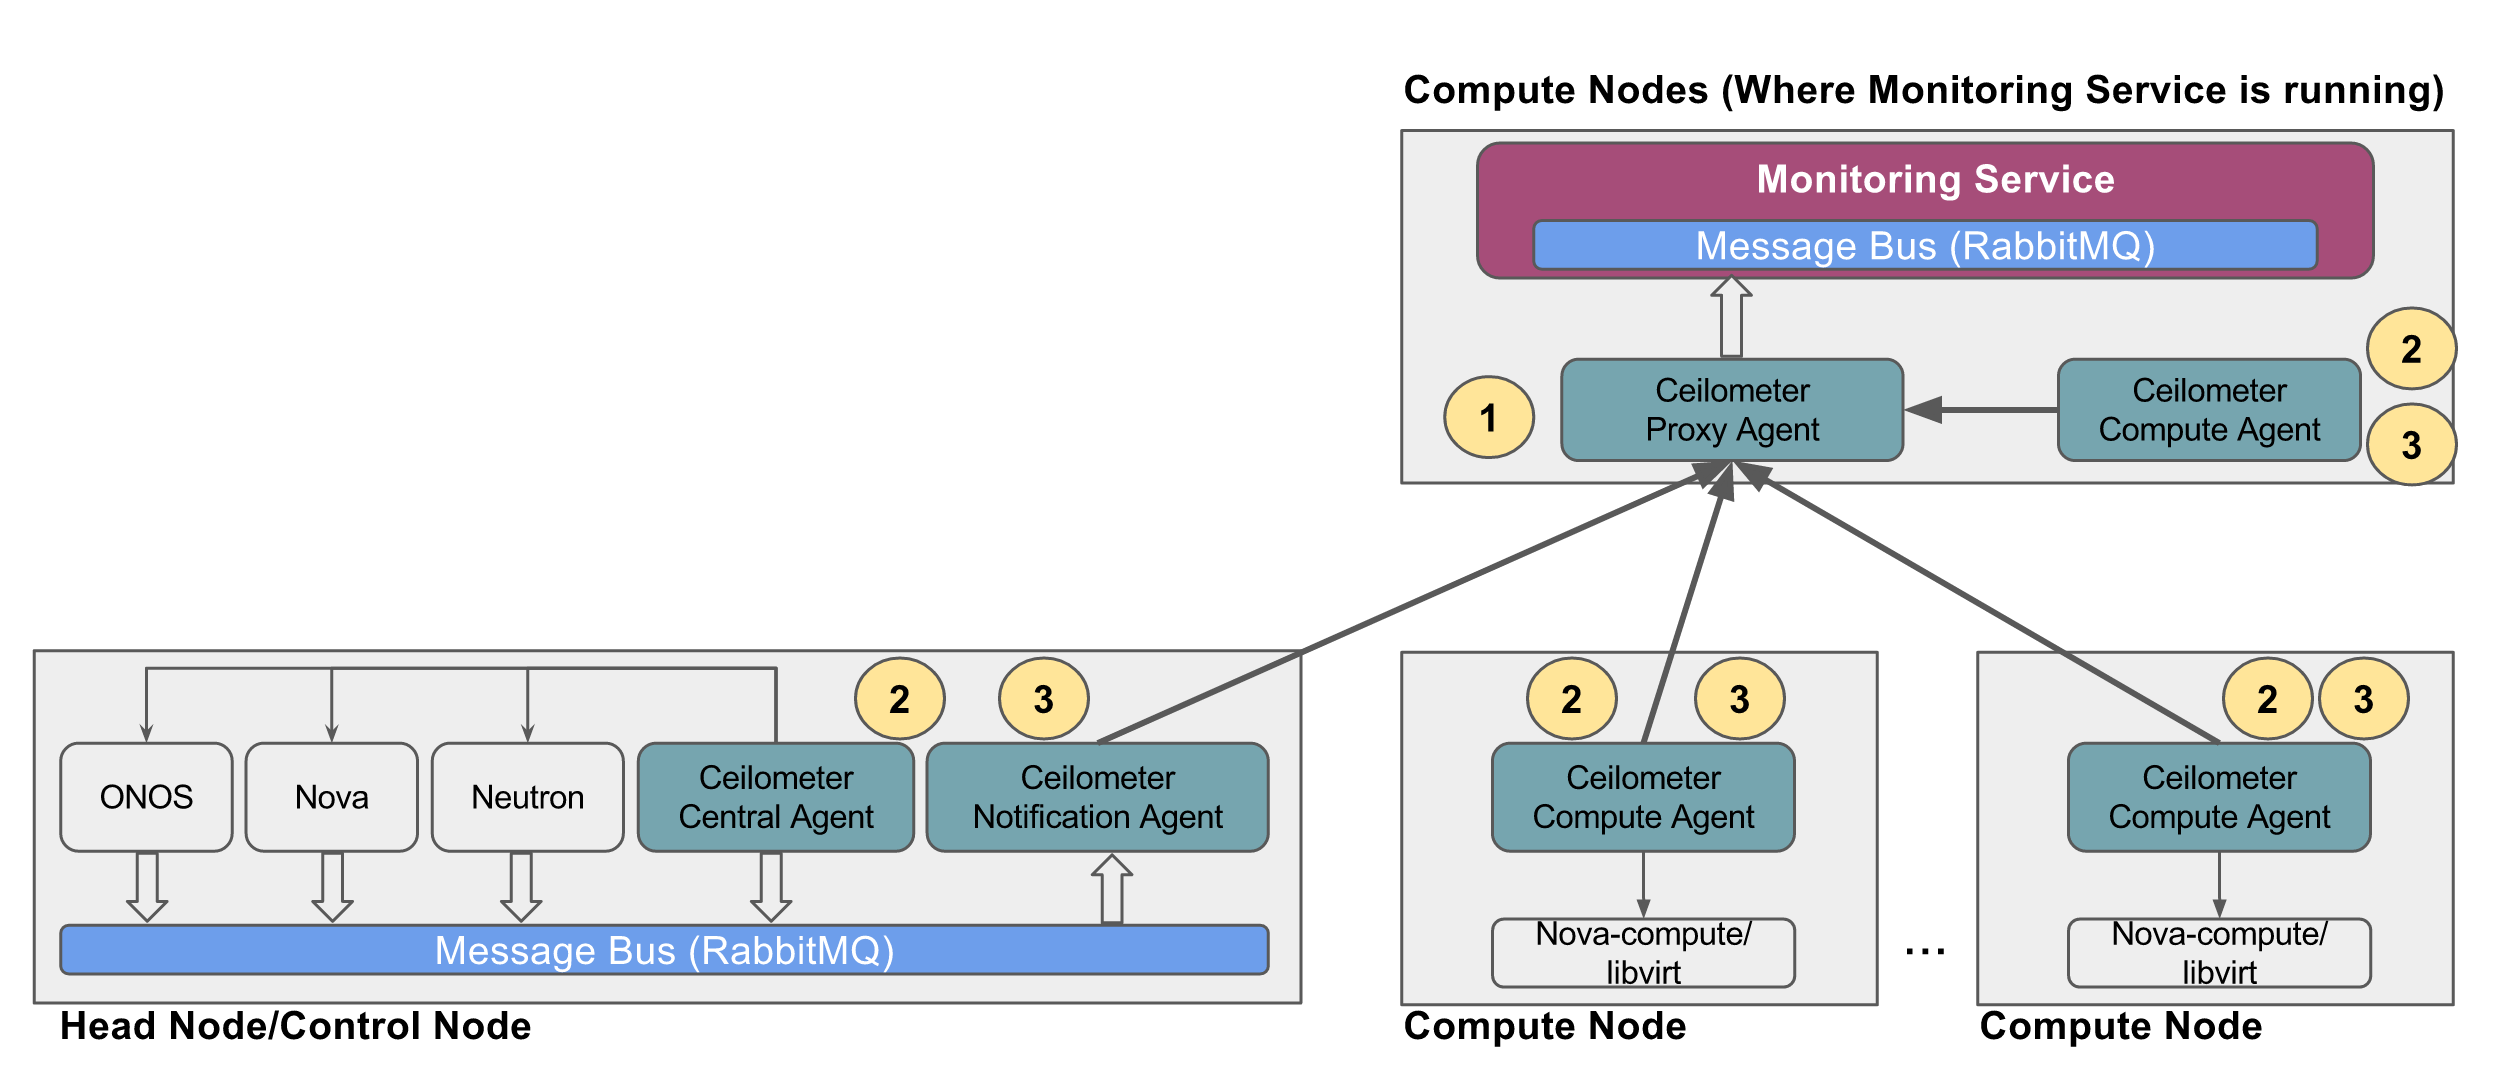
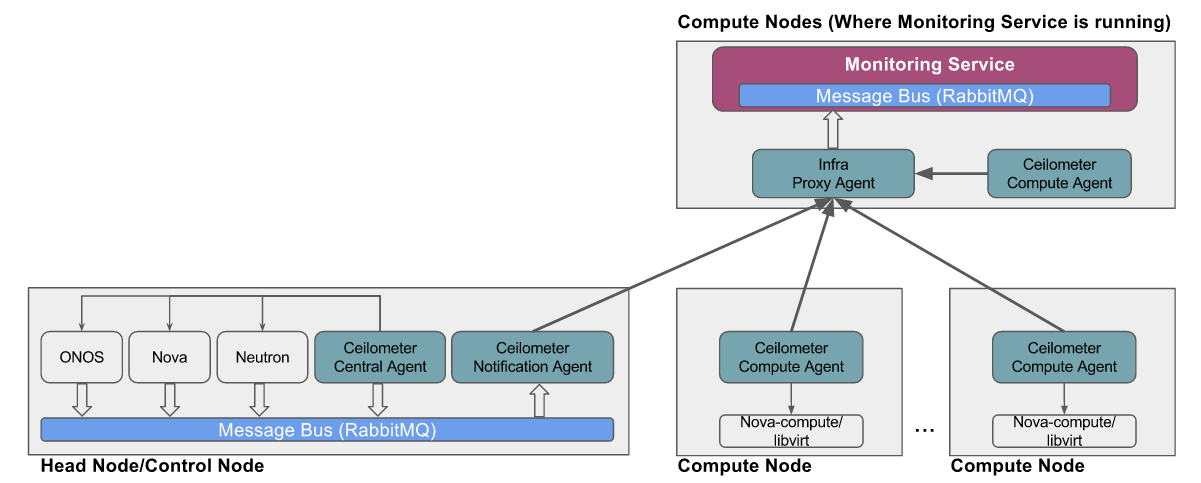
- The first step `make install-inframonitoring-agents` will deploy the programmable monitoring agents in all the servers (head nodes and compute nodes). These monitoring agents provide a programmatic interfaces to control monitoring of the various infrastructure services (OpenStack and ONOS)
- The second step `make enable-inframonitoring` will do the following:
- Deploy a "proxy agent" that proxies the data sent by infrastructure monitoring agents to monitoring service. (NOTE: In CORD POD, the monitoring agents running on management network do not have direct access to monitoring service network, hence this proxy mechanism is used where the proxy agent is deployed such that it is accessible from monitoring agents running on the management network and at the same time the proxy agent can access monitoring service. The proxy agent uses UDP as transport to receive the data from monitoring agent and uses RabbitMQ as transport to republish the same data to monitoring service)
- Invokes the APIs exposed by infrastructure monitoring agent to turn ON the monitoring of Openstack service
- Infrastructure monitoring agent exposes the following APIs:
- When start API is invoked, the infrastructure monitoring agent performs the following operations:
- Configure Ceilometer pipeline
- Edit the Ceilometer pipeline config file to punt all the collected data to proxy agent. e.g.
- - name: meter_sink
- transformers:
publishers:
- udp://<udp_proxy_ip_address>:4455/
- - name: meter_sink
- Restart the ceilometer agent services
- Restart ceilometer-agent-notification and ceilometer-agent-central agents on head node
- Restart ceilometer-agent-compute agents on all compute nodes
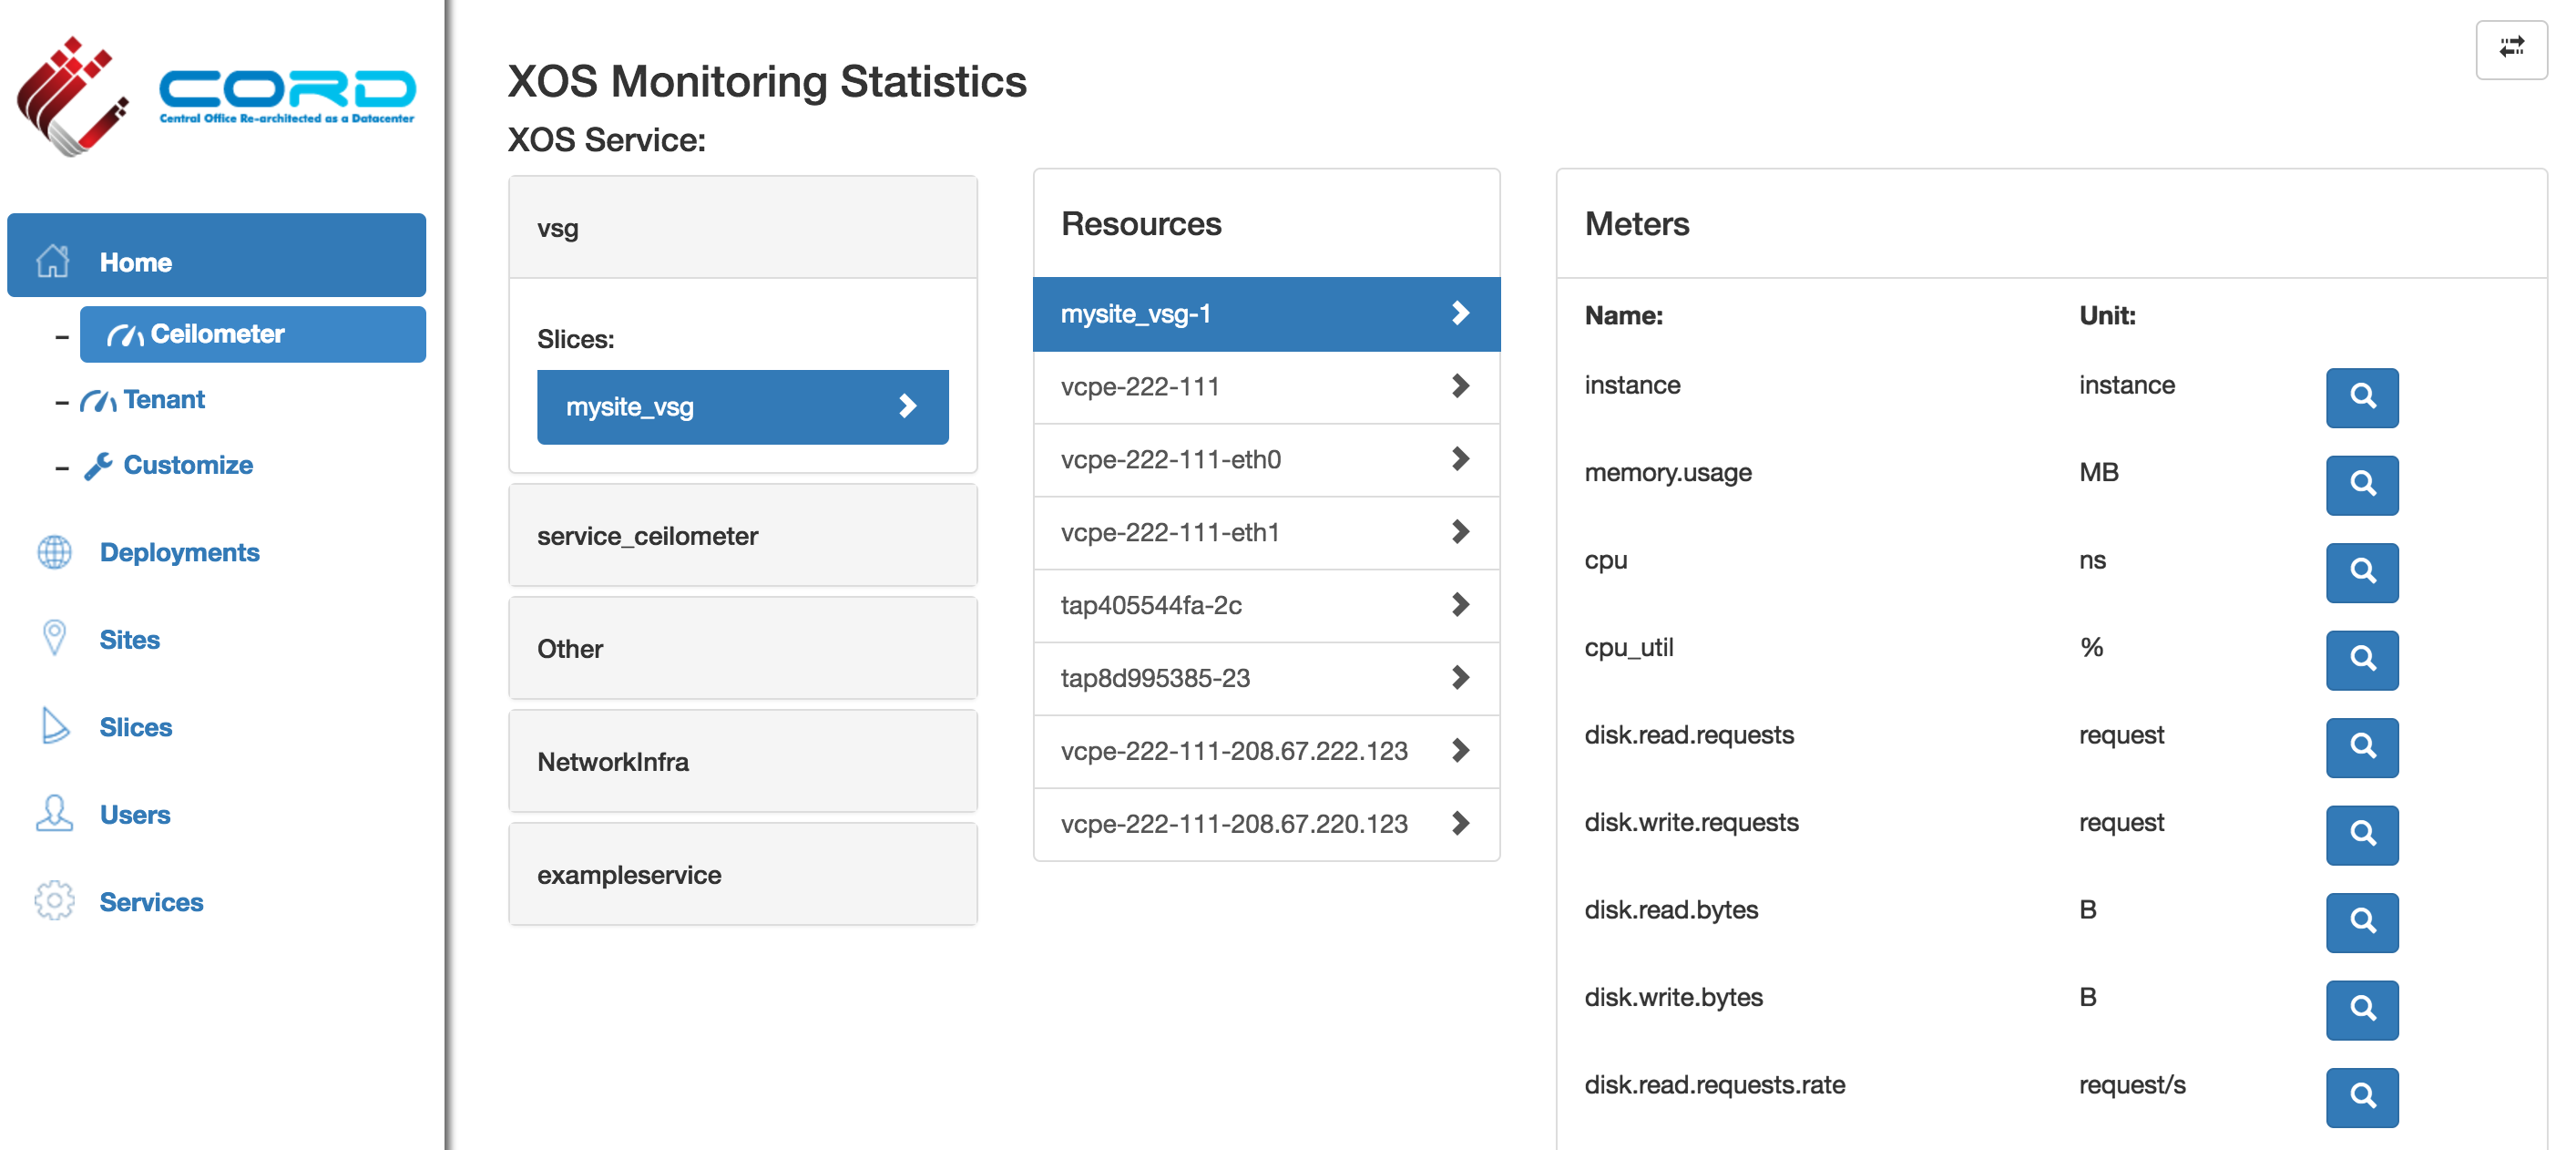
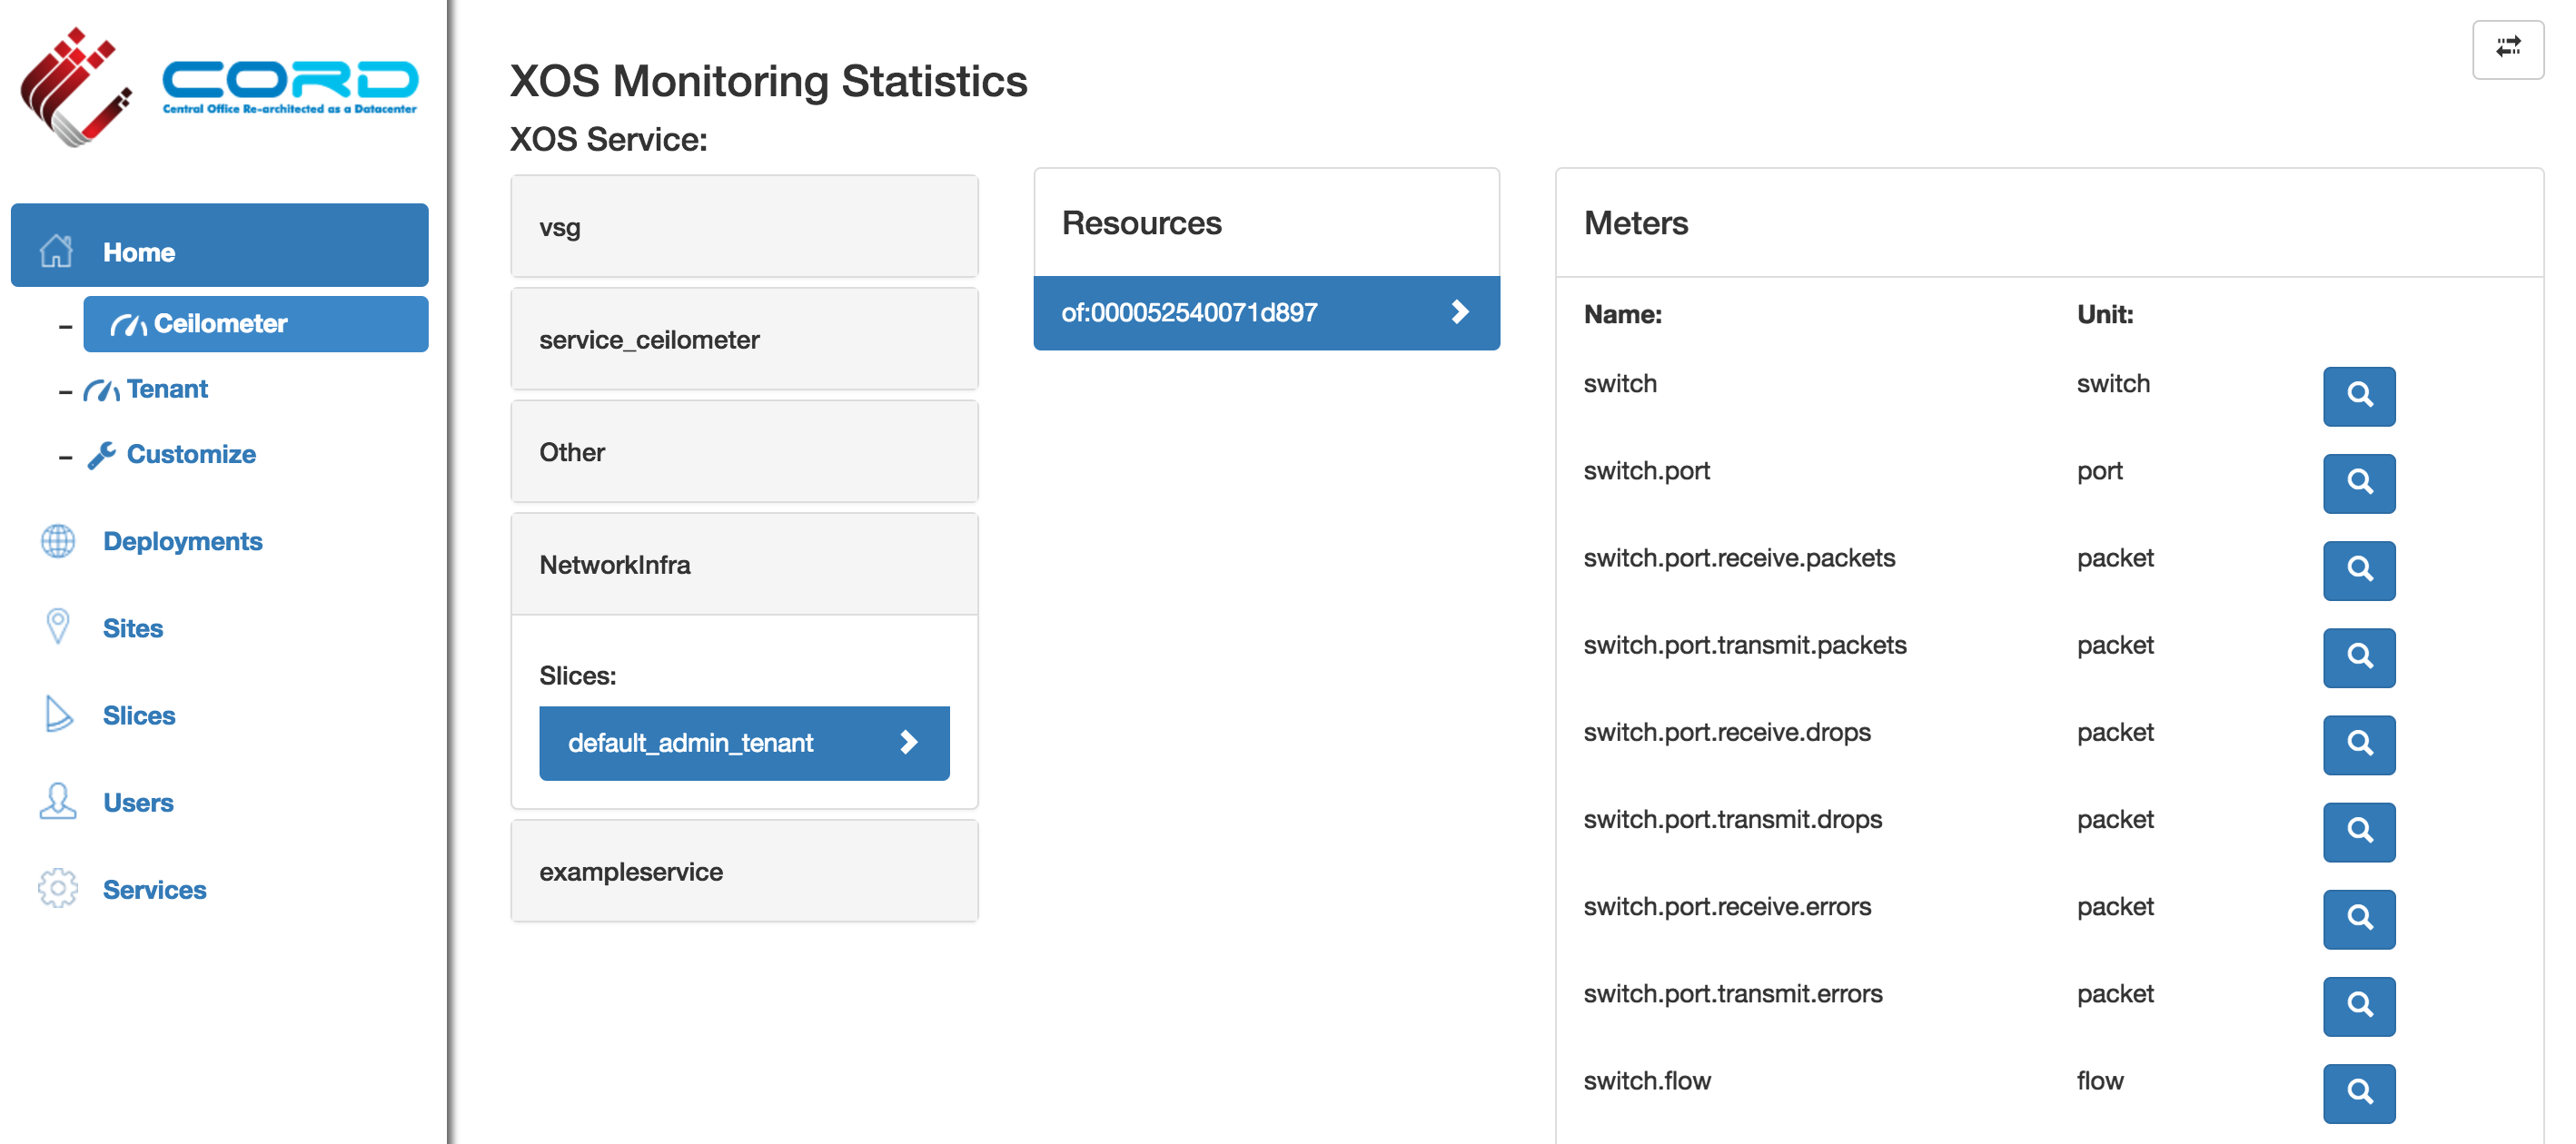
- Verify metrics from OpenStack and ONOS are displayed in monitoring dashboard:
Enable Monitoring of R-CORD vSG Services
vagrant@prod:~/service-profile/cord-pod$ make enable-vsgmonitoring
- The command `make enable-vsgmonitoring` will perform the following operations:
- Compose the vSG service with monitoring service such that vSG service instances will be able to publish the probe data directly to monitoring service. VTN service is responsible from creation this service composition.
- vSG service will start the monitoring agents for that service
- Load the collector plugin into monitoring service that can parse the probe data coming from vSG service (NOTE: In the current release, this plugin is pre-loaded into monitoring service. Eventually there will be a framework to load the plugins dynamically into monitoring service). The collector plugin will parse the probe data coming from vSG monitoring agents and pushes into higher layers
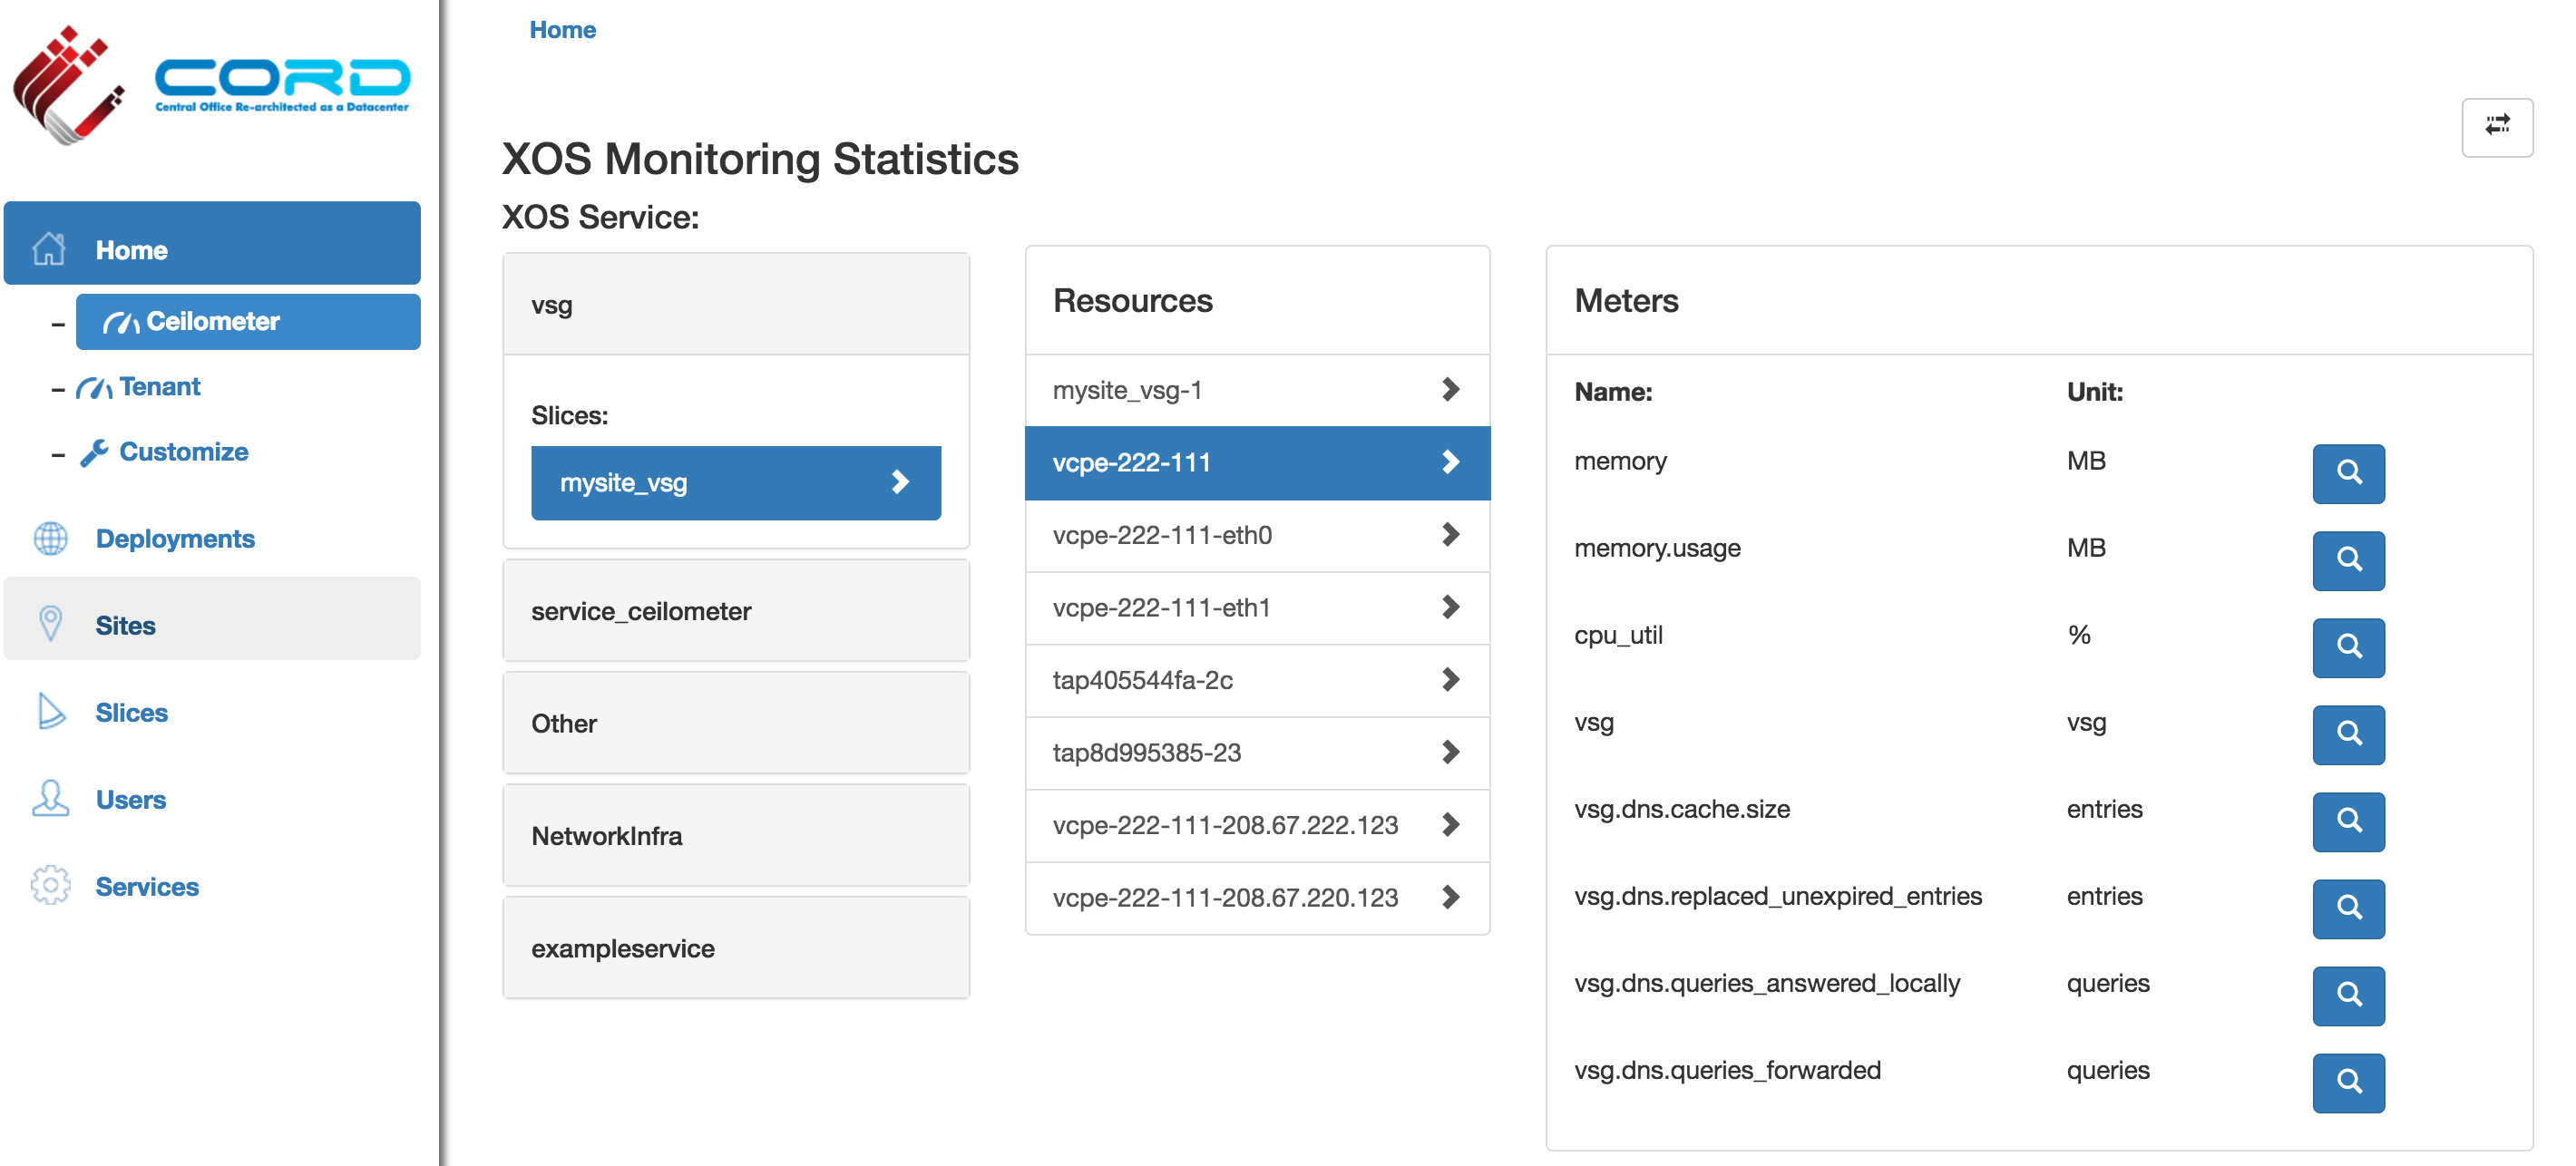
- Verify vSG service specific telemetry data is available in the monitoring dashboard:
Troubleshooting
- Monitoring service does not come up for a long duration
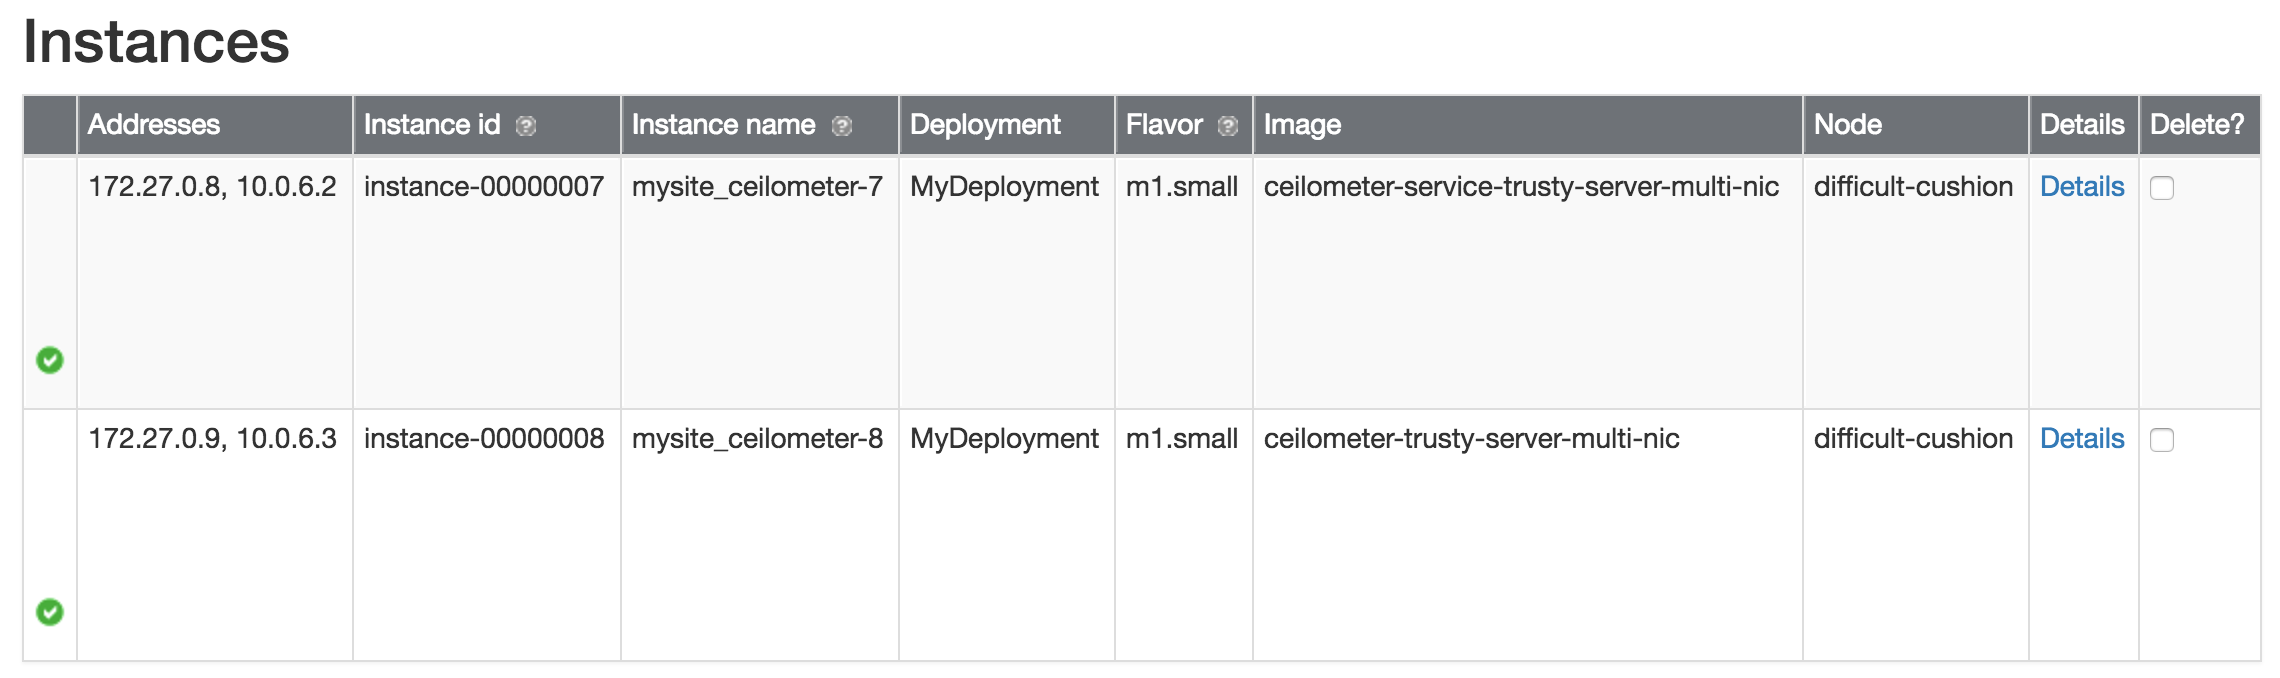
Verify Slice "mysite_ceilometer" has two instances with each instance having two IP addresses as shown below:
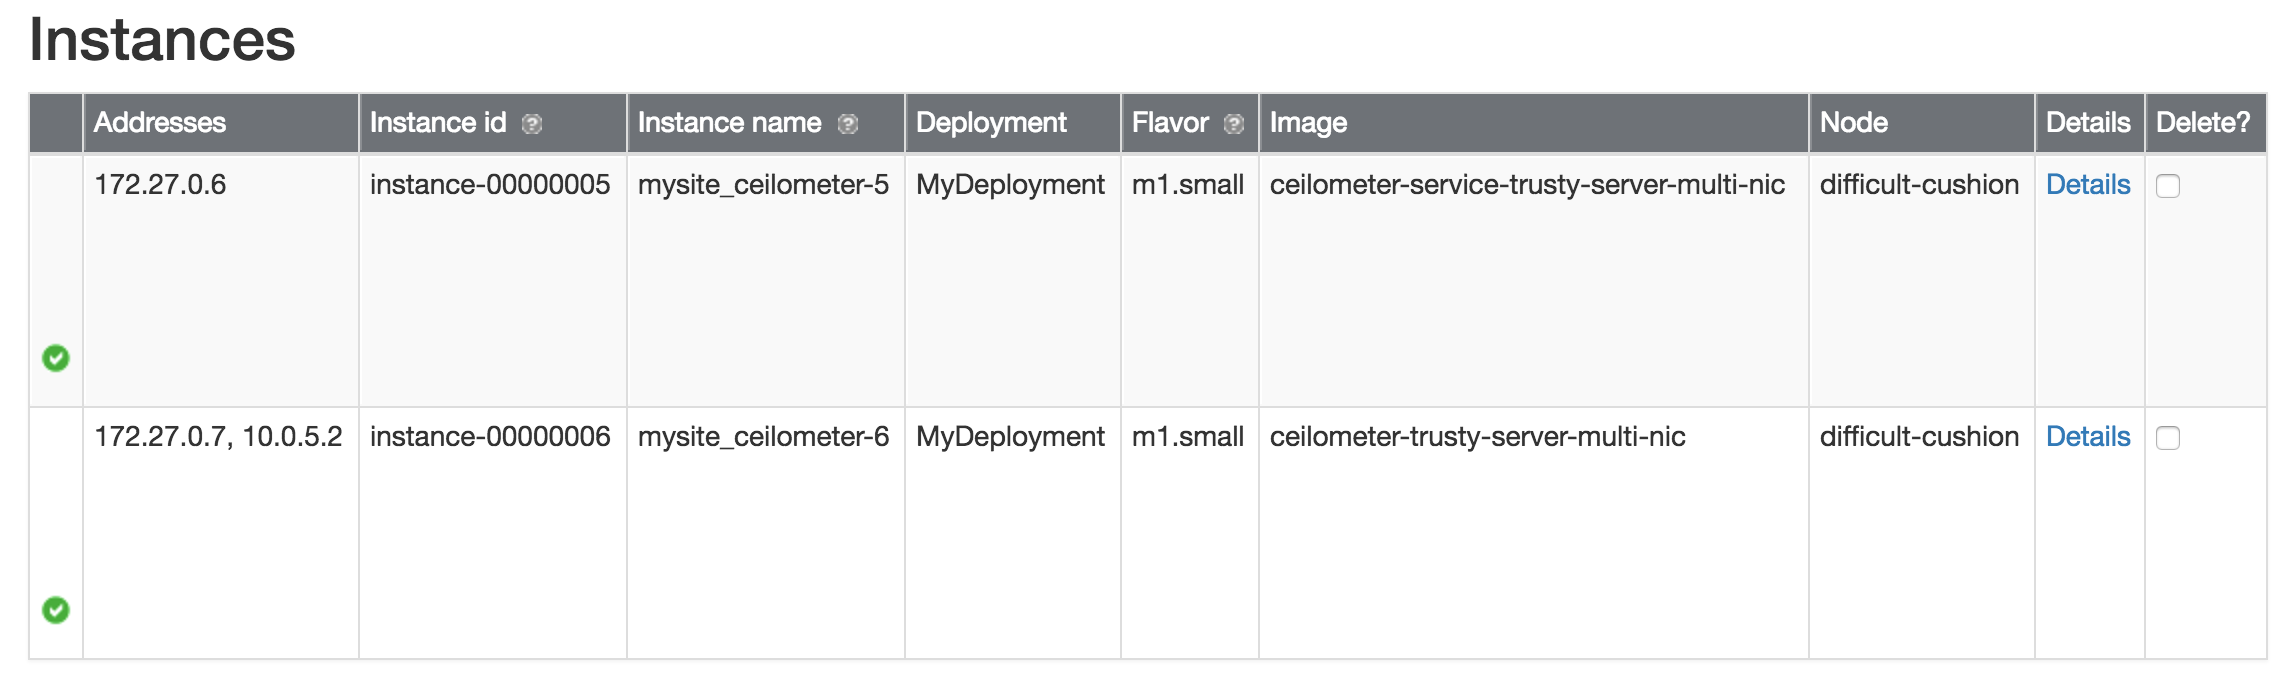
- Verify the one of the intermittent issue where not all the instances in "mysite_ceilometer" slice are getting all the required IP addresses (as shown below):
- If monitoring synchronizer (cordpod_xos_synchronizer_monitoring_1) is keep logging "unreachable" exception for a long time, that means though the instances in "mysite_ceilometer" slice acquire the needed IP addresses, those instances are not reachable over SSH. This is due to a potential pending issue in ONOS:
- Verify if ONOS-VTN is spitting the following exceptions in its logs (`ssh -p 8102 karaf@onos-cord` on head-node)
org.onosproject.store.service.StorageException$Timeout
java.lang.RuntimeException: java.lang.InterruptedException
org.onosproject.store.service.StorageException$Timeout
If so, restart ONOS-VTN docker container:
On Head Node:
-------------------
vagrant@prod:~$ cd onos-cord
vagrant@prod:~/onos-cord$ docker-compose kill xos-onos
Killing onoscord_xos-onos_1 ... done
vagrant@prod:~/onos-cord$ docker-compose up -d
Starting onoscord_xos-onos_1
vagrant@prod:~/onos-cord$
- Verify if ONOS-VTN is spitting the following exceptions in its logs (`ssh -p 8102 karaf@onos-cord` on head-node)