Join the Analytics CORD mailing list.
Join the CORD team (#a-cord channel) on Slack.
Overview
The goals of this initiative are to (1) build a general-purpose monitoring framework that collects, archives and delivers (via queries or notifications) performance probes/metrics about the physical devices and software elements in CORD; and (2) demonstrate this framework in the service of analytic applications that dynamically adapt CORD based on workload and anomalous events.
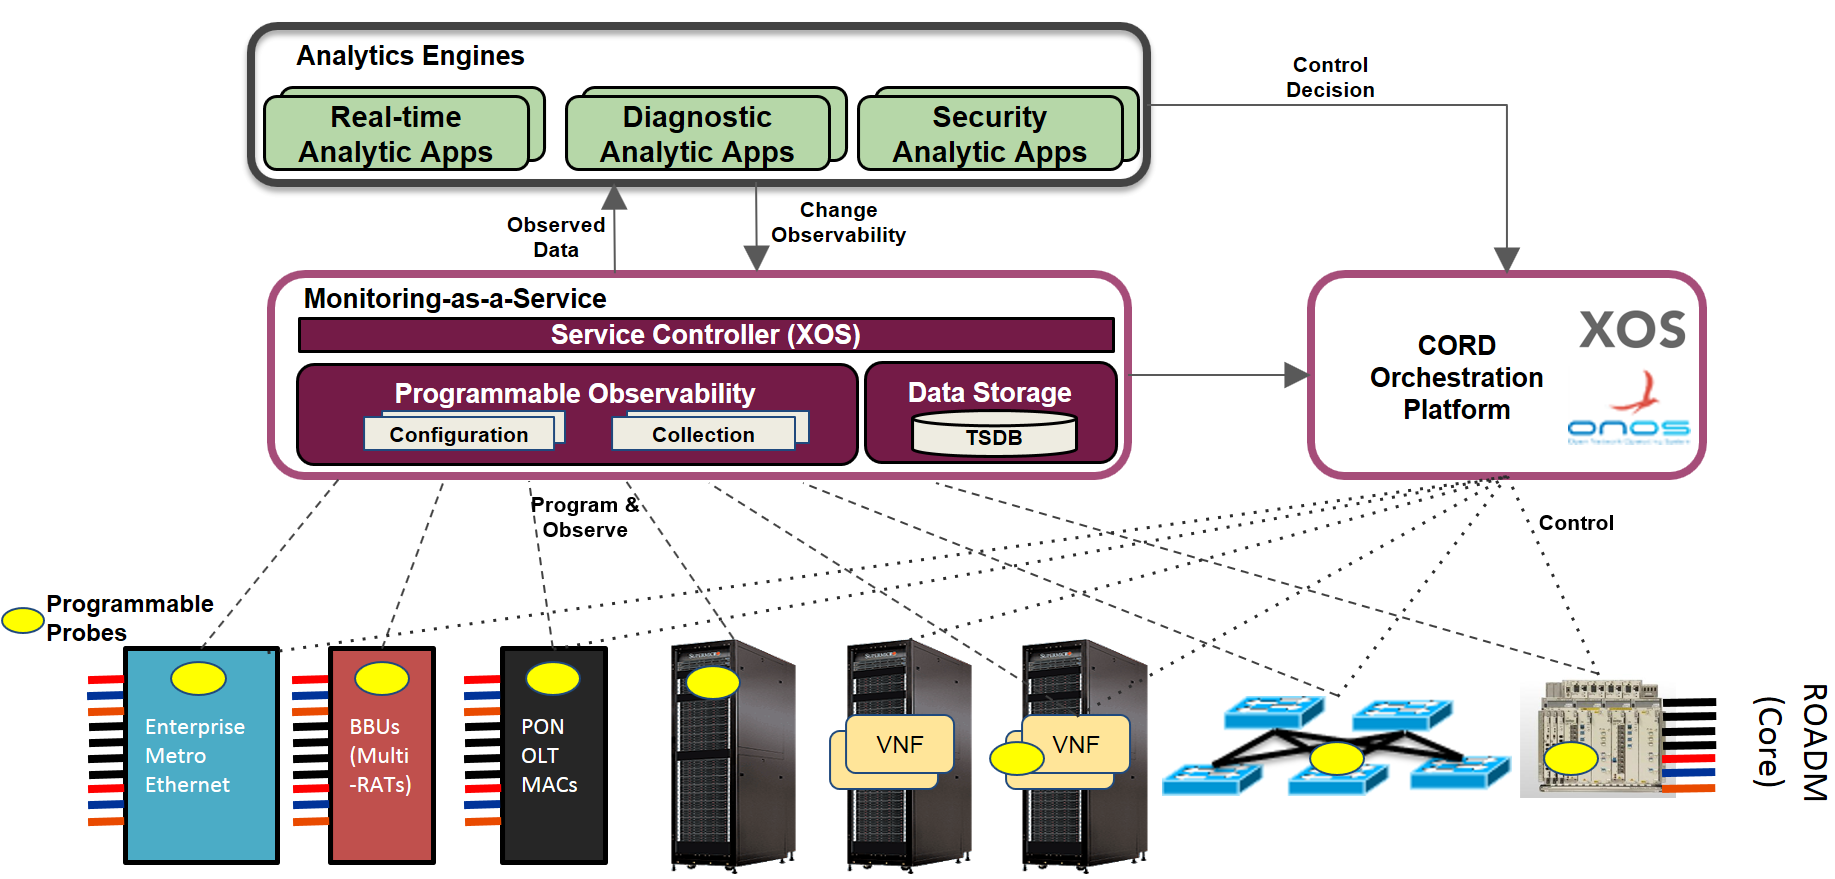
Key features of A-CORD are:
- Provides deep observability of both physical network elements and software element inside CORD: Dis-aggregated access devices (GPON OLT), dis-aggregated core devices (ROADMs), Fabric whitebox switches, Compute/Storage hardware, Software virtual switches (OVS), Software virtualized services running on the infrastructure
- Provides not only infrastructure level monitoring but also service level monitoring thereby enables end-to-end observability
- Programmatic interfaces to control level of observability
- Decouples Analytics applications from underlying probes thereby enabling true multi-vendor environments
- Allow multiple applications to consume the same collected data. i.e. collect once and use by many
- Applications can be data publishers too such that aggregated events can be fed into the system that can be consumed by other applications
Information about the overall architecture can be found at A-CORD_Architecture and in the CORD Design Note - CORD Monitoring Service
We are in the process of assembling a few end-to-end use cases to demonstrate A-CORD. We also have a dashboard that illustrates the metrics currently being collected. (TODO: Point to this dashboard.)
For more detail see: