Monitoring service is architected as multi-tenant, scalable service inside CORD by leveraging XOS service construction toolkit, where each service is composed of a "Service Controller" and set of "Service Instances".
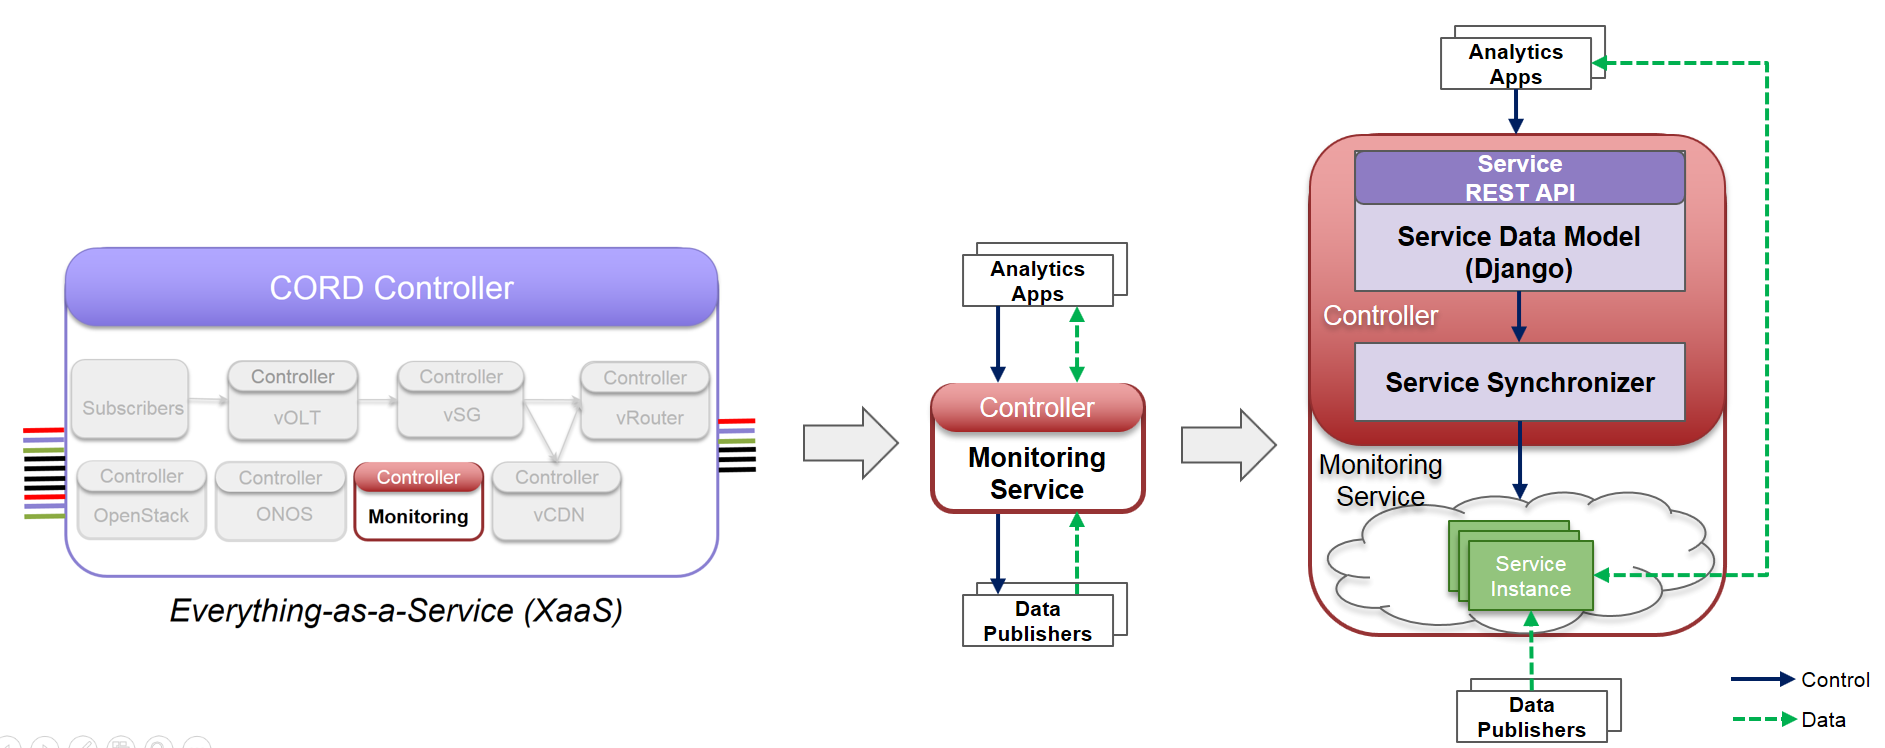
Fig1: Monitoring service as a mutli-tenant service inside CORD
Typically, “Service Controller” components run as part of XOS platform on the head node and “Service Instances” that implement the Service will be instantiated on CORD Compute cluster.
A "Service Controller" is composed of:
- Django model that define the authoritative state of service
- TOSCA based service and tenant configuration
- Synchronizer, that keeps the back-end systems that implement the service in sync with the authoritative state
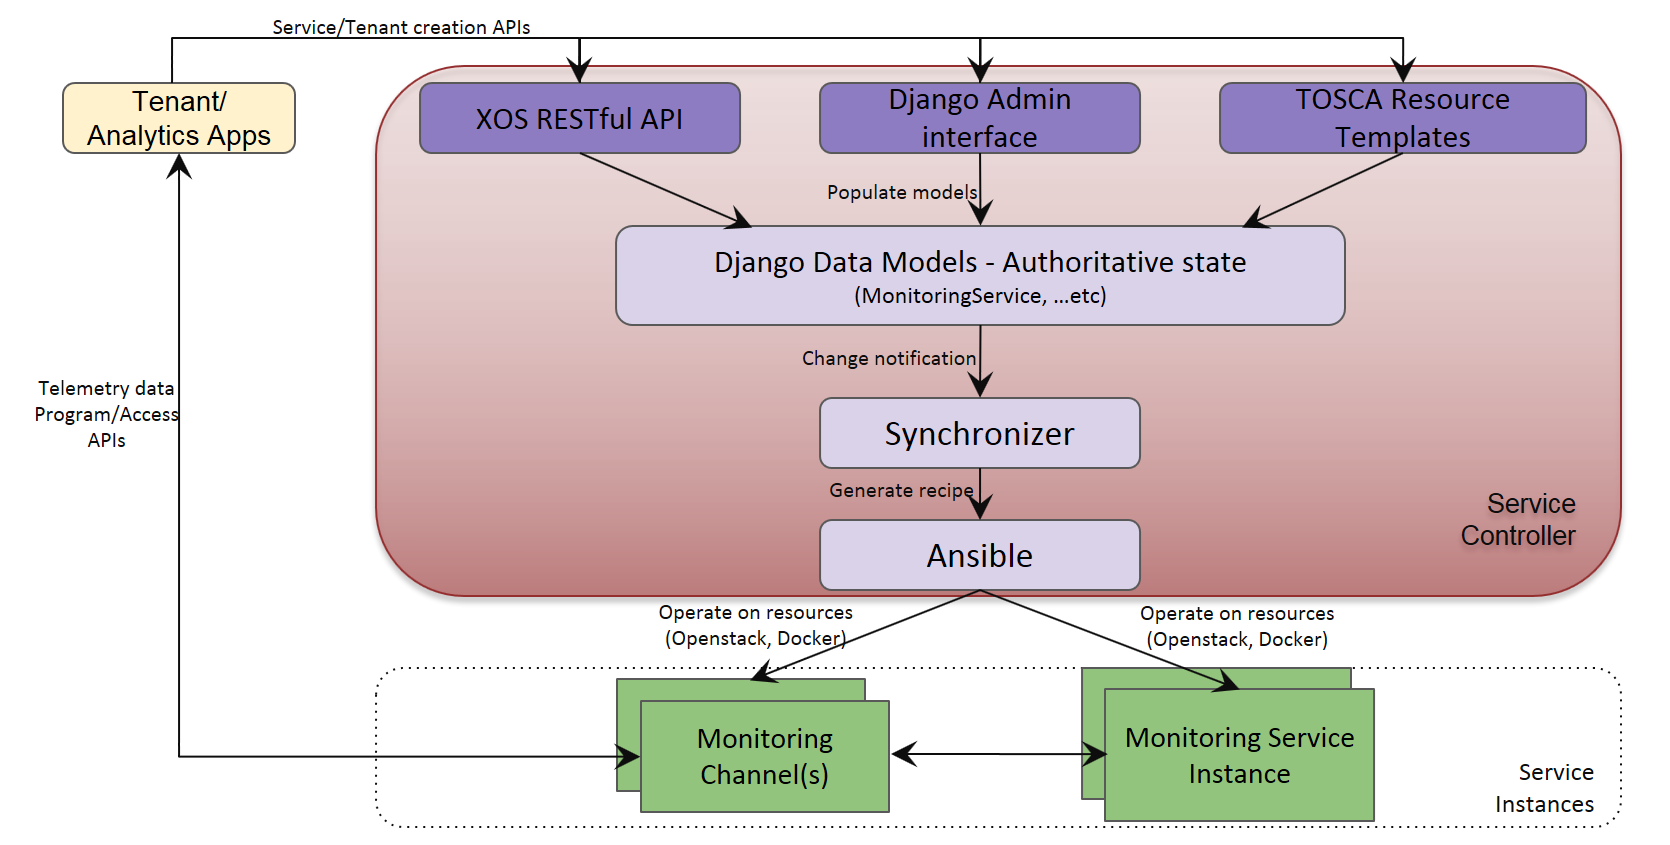
Fig2: Monitoring service controller and service instances
When monitoring service is instantiated through XOS TOSCA or REST APIs, the "Service Controller" spins up the monitoring service virtual machine instance(s) on the compute node.
The monitoring service virtual machine instance(s) are launched using pre-built image as defined at "Build Monitoring service instance custom image"
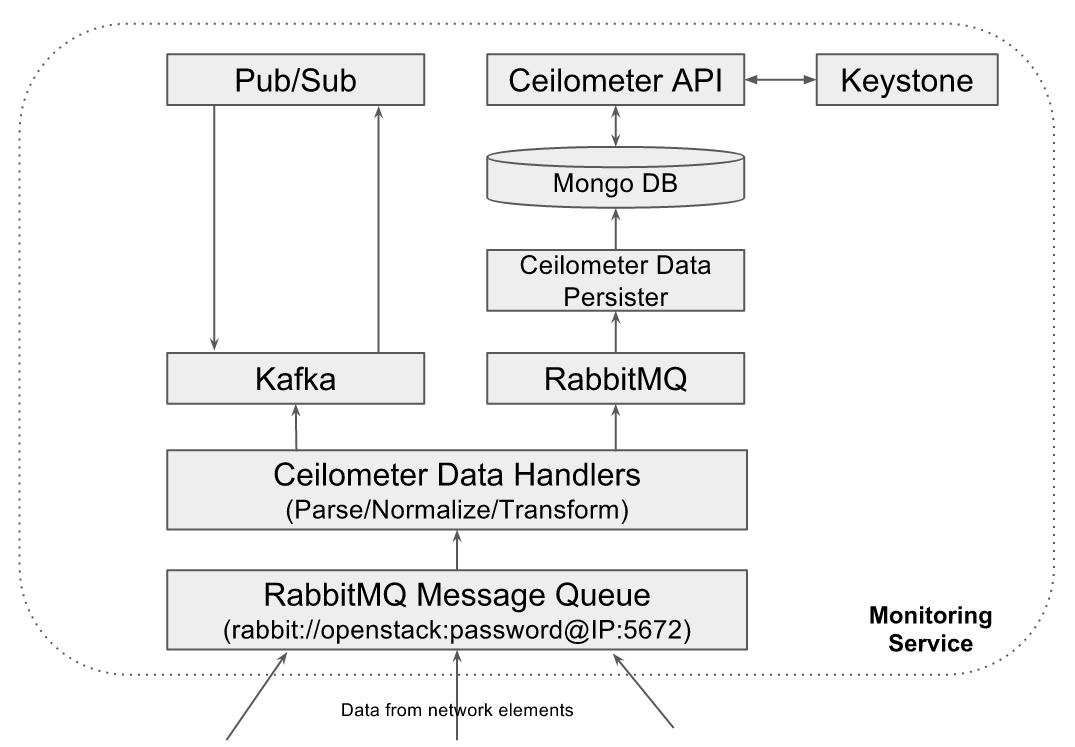
High level view of different software components running in Monitoring service Instance:
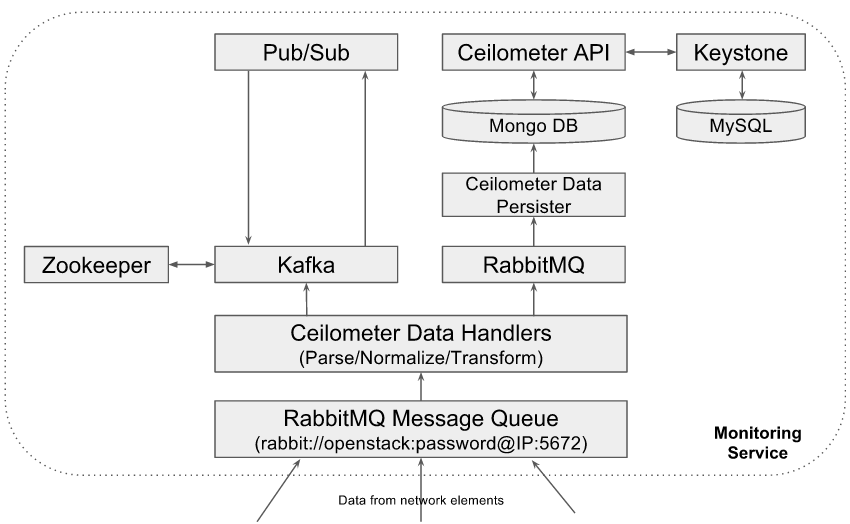
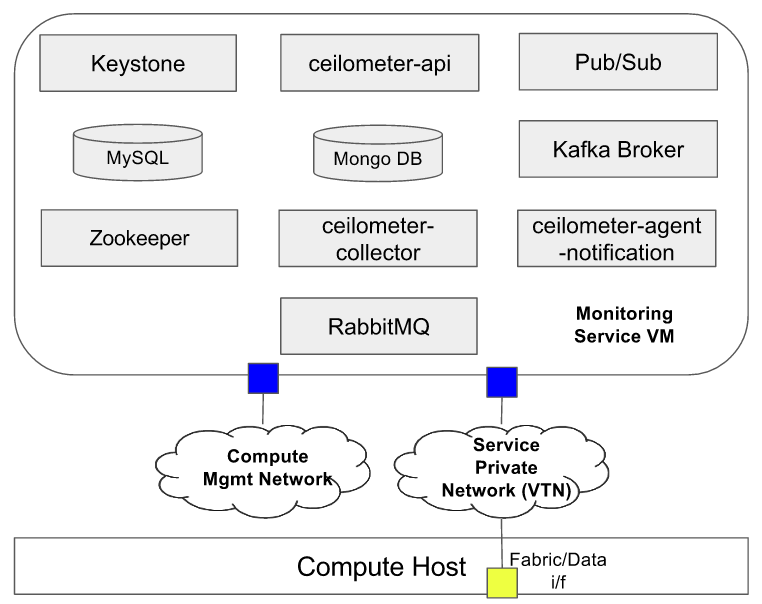
Fig3: Monitoring service instance components
- Ceilometer Data Handlers: Monitoring service uses OpenStack Ceilometer framework as its core data collection and processing components. It uses ceilometer-agent-notification daemons as data handlers that receives the data published by different network elements, parse the data and normalizes the data into common ceilometer sample formats. If configured, these data handlers transform the received metrics data into different metrics format such as unit_conversion, rate_of_change, accumulator...etc.
- RabbitMQ Message Queue: Monitoring service uses RabbitMQ message queues to collect the data from southbound network elements, which then will be processed by ceilometer data handlers. RabbitMQ message queue is also used to route the normalized and transformed samples towards ceilometer data persister.
- Ceilometer Data Persister: Monitoring service uses Openstack Ceilometer data persister ceilometer-collecter daemon that writes the data into configured backend database
- MongoDB: The databased backend being used in Monitoring service that holds all metrics and event data
- Ceilometer API:API interface to access the data from backend database
- Keystone: OpenStack Keystone module for authentication of ceilometer API access
- MySQL: Database backend for OpenStack Keystone
- Kafka Message Queue: Monitoring service will host a kafka messaging server to support notification of collected data to external applications. A copy of all normalized and transformed ceilometer samples will be published to the kafka message queue topic "xxxx", which will be consumed by "Pub/Sub" module of monitoring service. "Pub/Sub" module will republish the data to all subscribed applications using the same kafka message queue at user/application specified topics.
- Zookeeper: Kafka cluster manager
- Publish/Subscribe module: Provides an interface to applications to subscribe to a subset of telemetry data and receive notifications when the data/event is available. While subscribing, applications can specifiy the target where the data to be delivered. Currently "pub/sub" module supports kafka and UDP based data delivery mechanisms. This module consumes the data from kafka message queue topic "xxxx" and discard the data if no applications are interested in that.
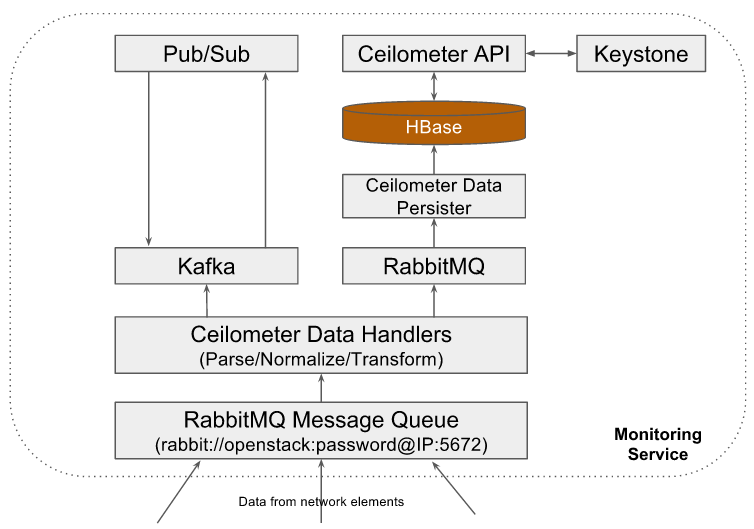
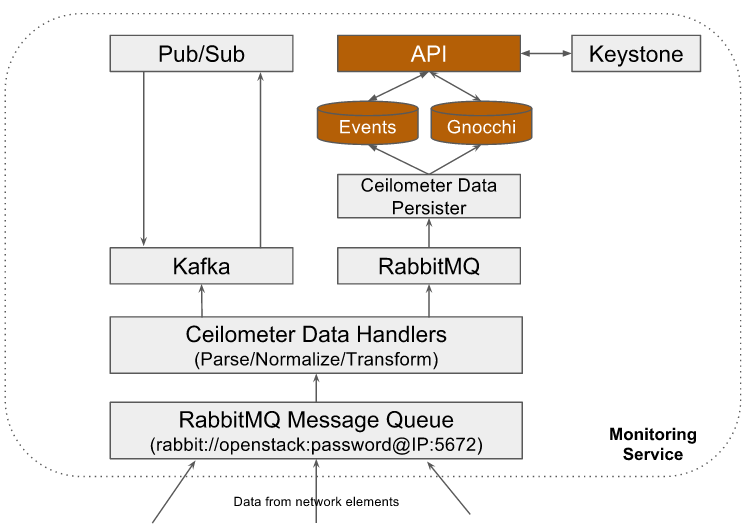
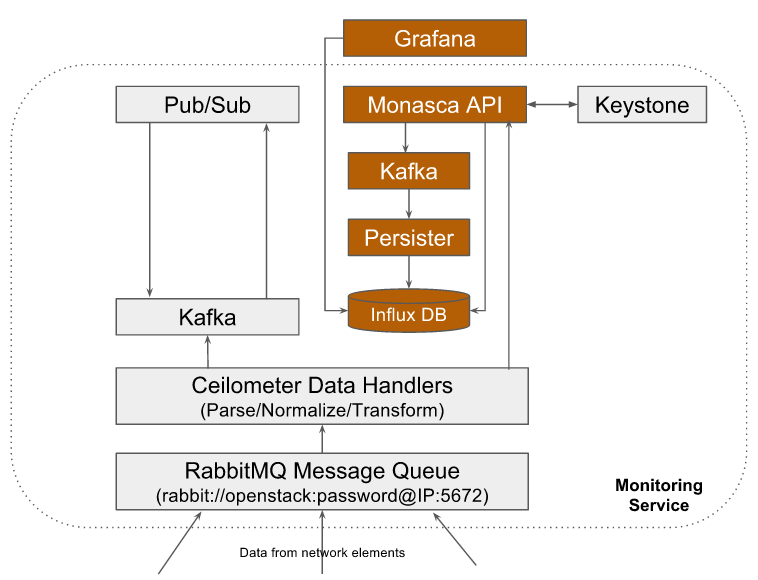
The architecture is modular such that components in this stack can be replaced with some other high performing components.
Some examples where monitoring service is instantiated with different database backends:
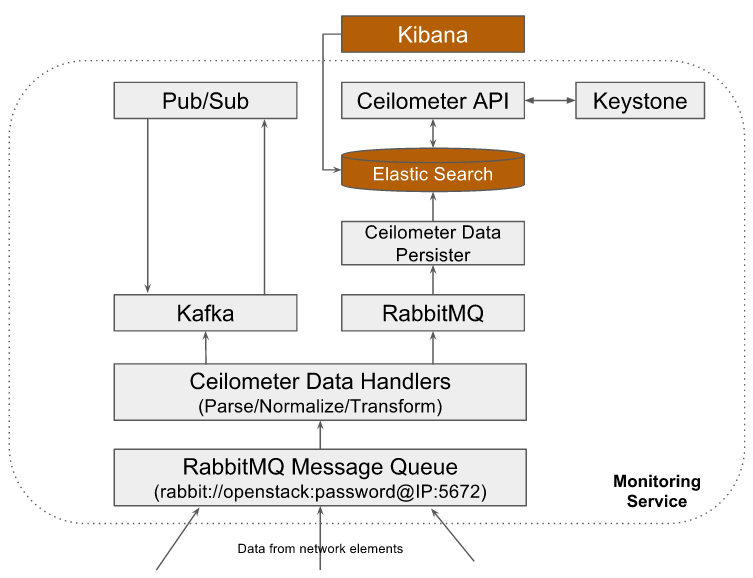
Deployment Model
Current CORD release supports deploying all monitoring service components in a single VM as shown below:
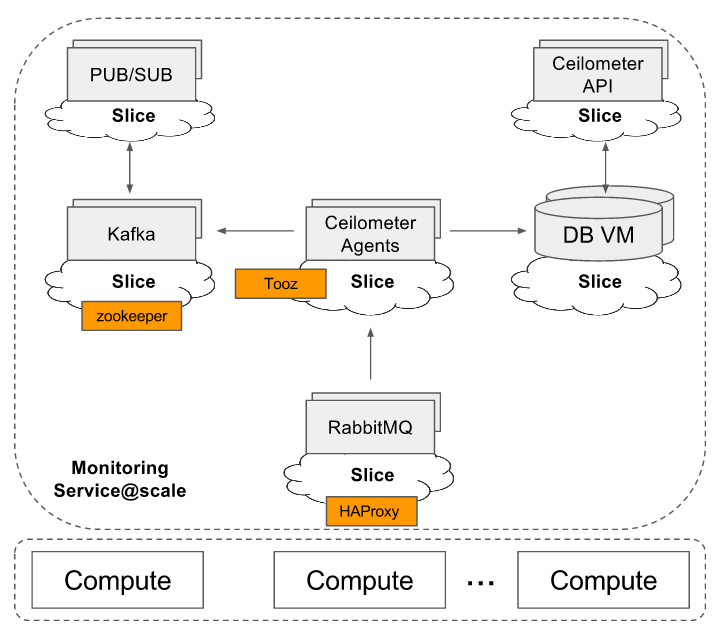
In order to support production environment, Monitoring service is capable of running in a scaled configuration (future work). A high level view of monitoring service deployment at scale:
- The first and foremost consideration for scaled deployment is running database on a different host as Ceilometer generates a LOT of WRITES as described at Google spreadsheet
- Use sharding and replica-sets
- Deploy RabbitMQ in a multi-node cluster configuration
- Deploy multiples of Ceilometer notification agents with "workload_partitioning" enabled and configure "pipeline_processing_queues" with value at minimum equal to number of notification agents