- Install Monitoring Service Components
- Publish Data to Monitoring Service
- Access Data from Monitoring Service
- Current Implementation
Install Monitoring Service Components
Refer to Bring-up A-CORD in CORD POD environment
Publish Data to Monitoring Service
Though technically any type of data can be published to Monitoring service, It is suitable for two types of telemetry data:
- Metrics/Measurements
- Events
Telemetry data can be of type:
- OAM
- Performance
- Faults
Data can be published by any type of element in CORD:
- Hardware (Access devices, Core/ROADM devices, Fabric whitebox switches, Compute nodes)
- Infrastructure Services (OpenStack services such as Nova, Glance...etc, ONOS control plane, ONOS data plane, ONOS services such as VTN, vRouter, vOLT...etc)
- User defined services/VNFs (vSG, vCDN, EPC VNFs...etc)
In order to be able to publish the data to monitoring service, there are three steps involved:
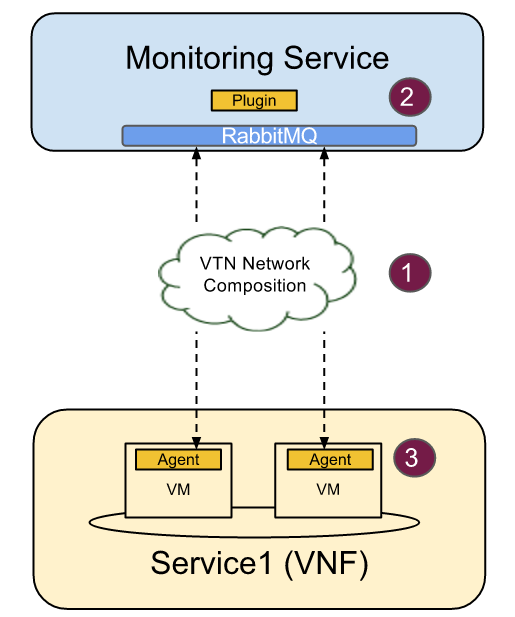
- Step1: Setting up network connectivity between target network element/service and monitoring service. Refer to Enabling Monitoring of vSG VNF on how to achieve this step.
- Step2: Loading ceilometer data handler plugin into monitoring service that can parse the published data. In current CORD release, this step is not automated yet and require user to push the python notification plugin directly into monitoring service VM. Refer to Instructions to define Ceilometer plugins
- Step3: Configure the monitoring agent in the target with the monitoring service rabbitmq URL(rabbit://openstack:password@<IP>:5672) to where the data needs to be published. Refer to Instructions to define monitoring agents
Currently Monitoring service supports publishing of telemetry data only using RabbitMQ messaging mechanism. The formatted message has two parts: Fixed header and unstructured payload. All the messages should contain the fixed header fields for the RabbitMQ server to process the messages. The payload part of the message is unstructured and entirely depends on how the service specific notification plugin expects the messages.
msg = {'event_type': 'vsg.dns.cache.size',
       'message_id':six.text_type(uuid.uuid4()),
       'publisher_id': 'vsg_publisher_on_compute1',
       'timestamp':datetime.datetime.now().isoformat(),
       'priority':'INFO',
       'payload': {'name': 'vsg.dns.cache.size',
                   'unit': 'entries',
                   'result': 200,
                   'resource_id':'vsg-222-333',
                   'user_id':'1e3ce043029547f1a61c1996d1a531a2',
                   'tenant_id':'3a397e70f64e4e40b69b6266c634d9d0'
                  }
      }
The service specific ceilometer plugin parses the published data and normalizes in to ceilometer sample/event format (as shown below):
{
      name=message['payload']['name'],
      type=sample.TYPE_GAUGE,
      unit=message['payload']['unit'],
      volume=message['payload']['result'],
      user_id=message['payload']['user_id'],
      project_id=message['payload']['tenant_id'],
      resource_id=message['payload']['resource_id'],
      message=message
}
Access Data from Monitoring Service
Monitoring service supports multi-tenancy such that each tenant is able to access only to the data of the network resources belonging to that tenant. This tenant abstraction is called monitoring channel. Typically the tenants would be the analytics applications running on top of this service. So, the tenant applications should acquire a monitoring channel before accessing the data from monitoring service. The monitoring channel object would embed the URL (monitoring_channel_url) to be used by tenant applications for accessing APIs.
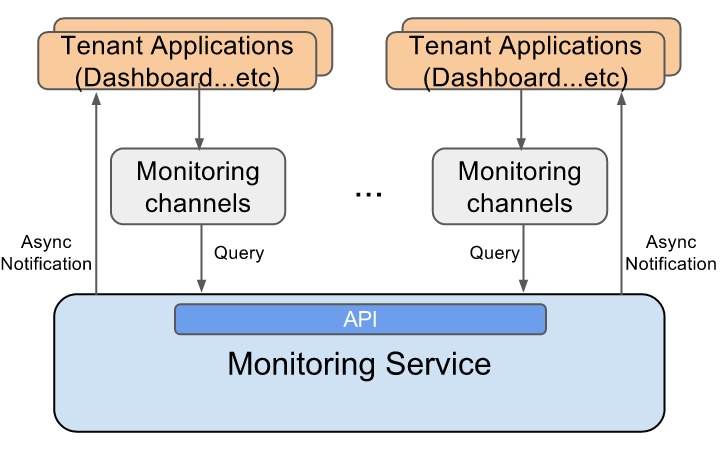
Once collected by monitoring service, the data is available for application consumption in two ways: Query APIs, Publish/Subscribe APIs.
| API | Description |
|---|---|
| http://<monitoring_channel_url>/v2/resources | GET all tenant resources |
| http://<monitoring_channel_url>/v2/resources/(resource_id) | GET details of specified resource |
| http://<monitoring_channel_url>/v2/meters | GET all tenant meters |
| http://<monitoring_channel_url>/v2/meters/(meter_name) | GET details of specified meter |
| http://<monitoring_channel_url>/v2/meters/(meter_name)/statistics | GET statistics for a given meter type |
| http://<monitoring_channel_url>/v2/samples | GET samples for a given meter type |
| http://<monitoring_channel_url>/v2/samples/(sample_id) | GET details of specific sample |
| http://<monitoring_channel_url>/subscribe | Subscribe to telemetry data |
| http://<monitoring_channel_url>/unsubscribe | UnSubscribe to telemetry data |
Define Ceilometer data handler plugin
- NOTE: With later releases Openstack, a new approach is introduced to avoid hand coding of notification handlers for every newly added meters, instead new meters can be added to the framework simply by defining them in separate configuration file, called “ceilometer/meter/data/meter.yaml”. Current release of CORD Monitoring service does not support these mechanisms yet. Until then, the below procedures apply.
- Ceilometer has defined an extensible notification framework such that new notification listeners can be added to the framework by simply extending the existing interface and overwriting few methods of that interface. Refer to vSG ceilometer plugin for example plugins
- Once the plugin is implemented, push the related files directly into monitoring service VM under /usr/lib/python2.7/dist-packages/ceilometer/network/ext_services/<service>/ folder
Ceilometer Notification framework loads one or more listener plugins, using the namespace “ceilometer.notification” as defined in /usr/lib/python2.7/dist-packages/ceilometer...-egg.info/entry_points.txt file. So all the defined notification listeners for a given service should be added to this file under the “ceilometer.notification” namespace. Sample code snippet for “vcpe” notification listeners is given below:
entry_points.txt[ceilometer.notification] . . . vcpe= ceilometer.network.ext_services.vcpe.notifications:VCPENotification vcpe.dns.cache.size= ceilometer.network.ext_services.vcpe.notifications:VCPEDNSCacheSize vcpe.dns.total_instered_entries= ceilometer.network.ext_services.vcpe.notifications:VCPEDNSTotalInsertedEntries vcpe.dns.replaced_unexpired_entries= ceilometer.network.ext_services.vcpe.notifications:VCPEDNSReplacedUnexpiredEntries vcpe.dns.queries_answered_locally= ceilometer.network.ext_services.vcpe.notifications:VCPEDNSQueriesAnsweredLocally vcpe.dns.queries_forwarded= ceilometer.network.ext_services.vcpe.notifications:VCPEDNSQueriesForwarded vcpe.dns.server.queries_sent= ceilometer.network.ext_services.vcpe.notifications:VCPEDNSServerQueriesSent vcpe.dns.server.queries_failed= ceilometer.network.ext_services.vcpe.notifications:VCPEDNSServerQueriesFailed
- Ensure ceilometer services (ceilometer-agent-notification, ceilometer-collector, ceilometer-api) are restarted after making any of the above changes
Monitoring Agents
Refer to Sample event publisher code snippets that publishes data to Ceilometer rabbitmq notification bus
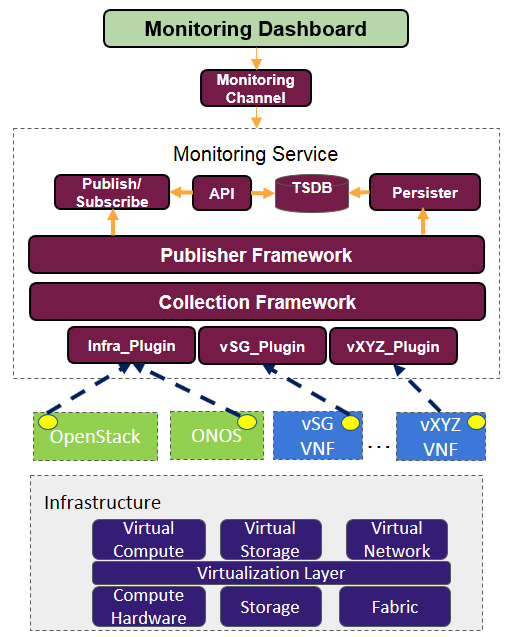
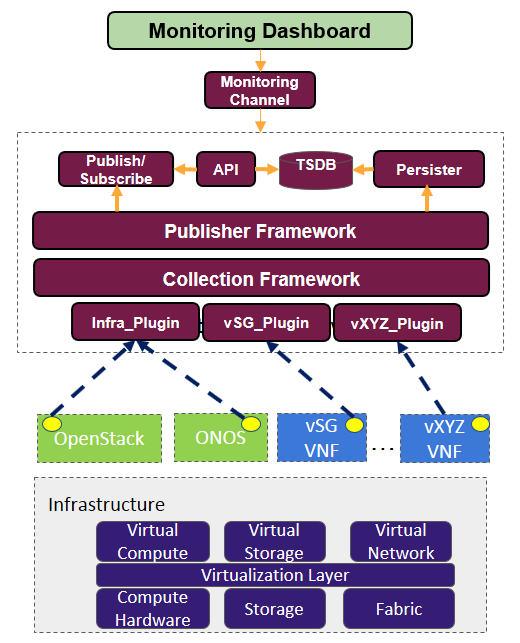
Current Implementation
The following features are supported in current CORD release:
- On-boarding of Monitoring service
- Enable monitoring for infra services (OpenStack and ONOS)
- Enable monitoring for vSG service
- Framework to enables monitoring for 3rd party user defined service
- Monitoring dashboard